Flexera Data Models
FlexNet Manager Suite includes Flexera Analytics, a technology that enables you to create reports and to customize dashboards, either for your enterprise or for personal use. You can build and/or customize reports and dashboards using data contained in the Flexera data models.
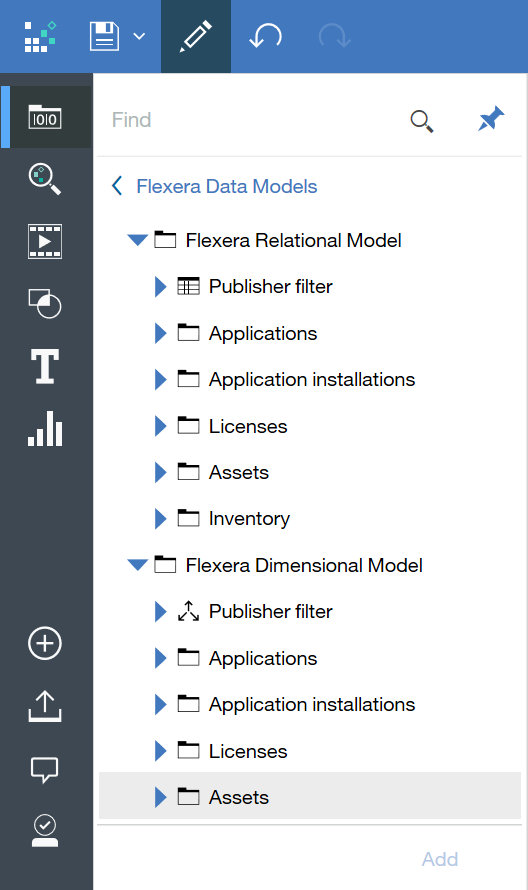
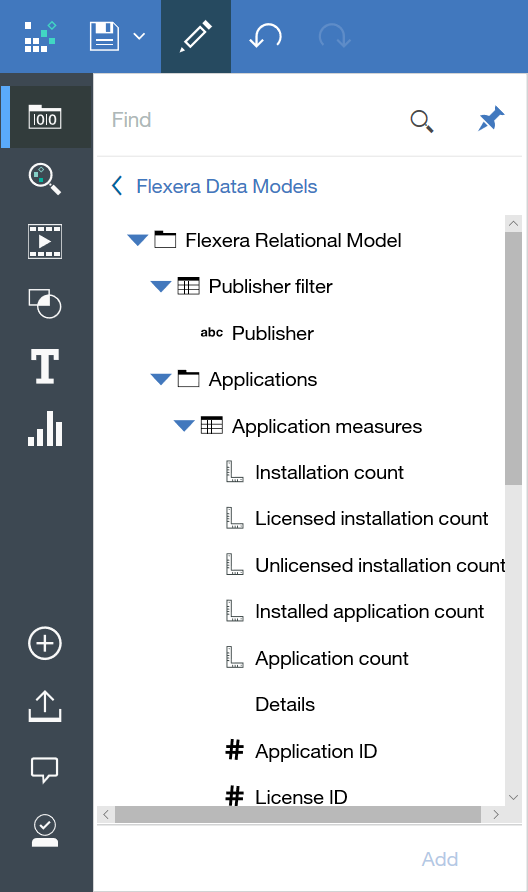
To help you use this data when customizing dashboards, widgets, and reports, Flexera Analytics provides two data models that organize your asset-management data and define how the data relates to each another. Within the data models, folders organize and structure the data into subject-area categories. Each folder in the subject area contains two types of data: measures and attributes. Measures represent numbers and facts, and attributes represent categories of descriptive data.
The two data models are:
- Relational model (see Relational model)
- Dimensional model (see Dimensional model)
Relational model
Dimensional model
The dimensional model organizes data using measures and attributes but uses a hierarchy structure that enables you to drill up and drill down to see how data relates to other functionality.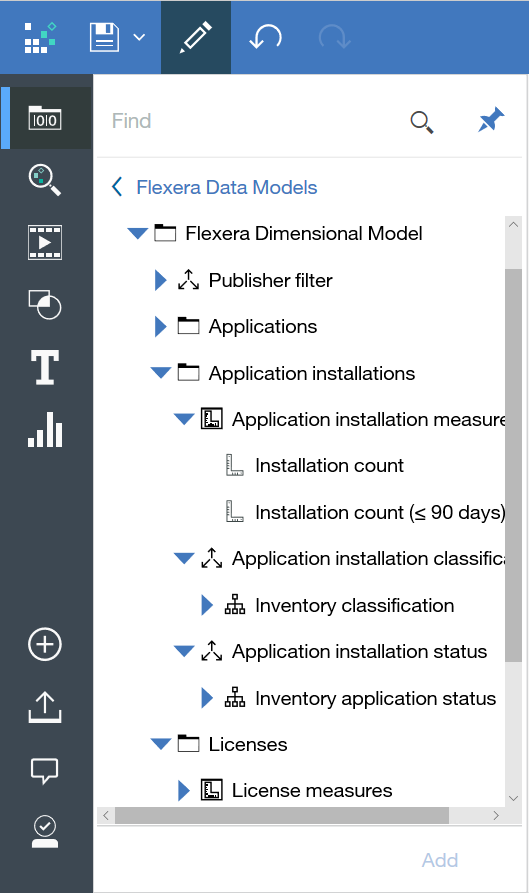
FlexNet Manager Suite (On-Premises)
2020 R1