Analyze Group View
AdminStudio 2023 | 25.0 | Application Manager
Edition:Application Manager is included with AdminStudio Professional and Enterprise Editions.
The Analyze Group View has two formats: standard list format and a graphical, pie chart view of the same data. You can toggle between the list and chart view by clicking the toggle button at the top right of the page:

On the Chart view, you can make selections from the drop down lists to filter each pie chart by various criteria: operating systems, virtual format, or dependencies type.
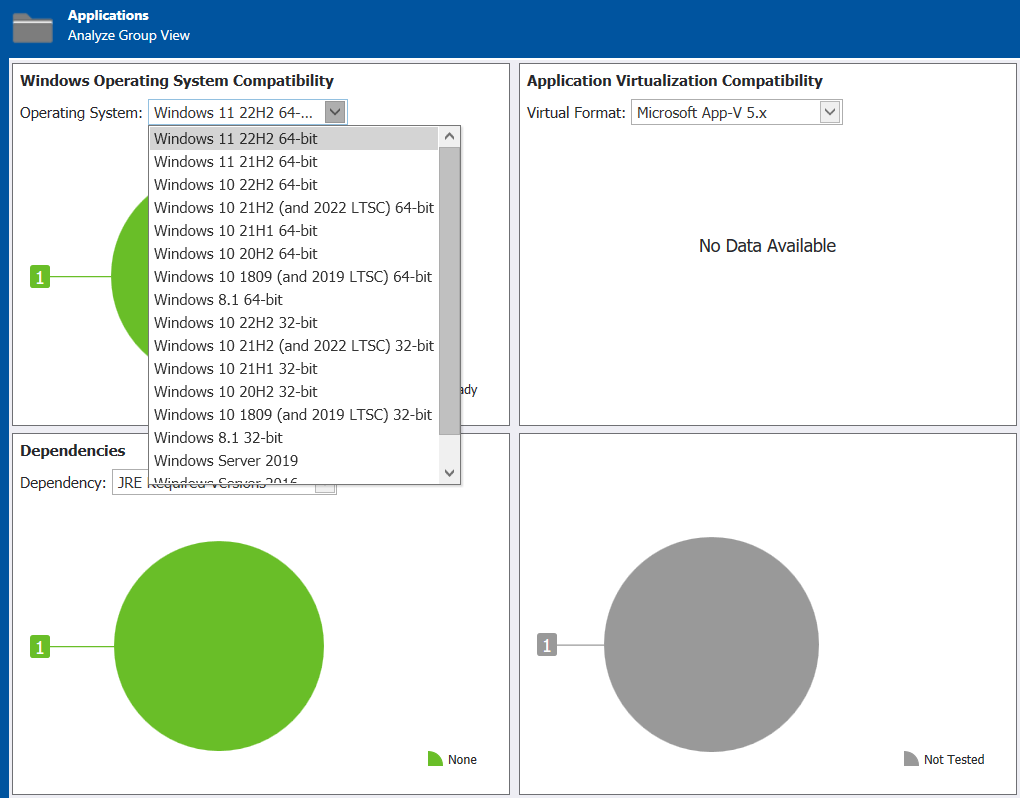
Analyze Group View - Pie Chart View
The list format of the Analyze Group View, which opens when you select a group in the tree, displays icons to indicate the overall test status of applications and/or subgroups, as described in About Status Icons, in each of the following columns:
| • | Operating System Compatibility |
| • | MSIX Conversion Capability |
| • | Application Virtualization Compatibility |
| • | Remote Application Publishing Compatibility |
| • | Best Practices |
| • | Risk Assessment |
| • | Application Conflicts |
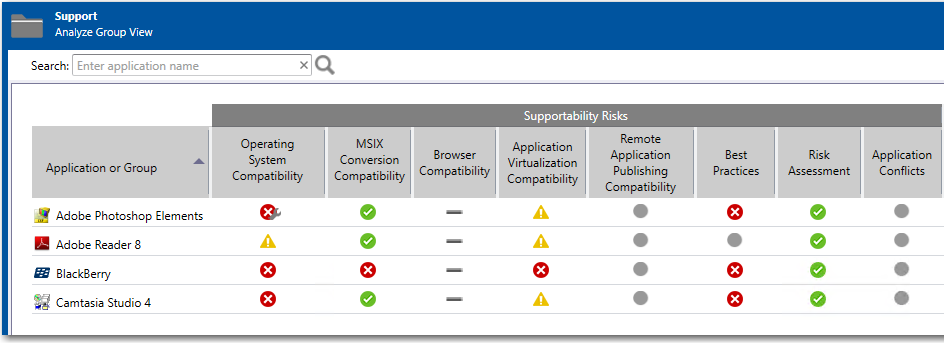
Analyze Group View - List View
A status icon is displayed in each of the columns to indicate the test status of the tests in that category for the group, application, or package. All of the columns on this view are sortable by clicking on the column heading.
To view the detailed test results for a single package, select the package in the Application Catalog tree to open the Analyze Deployment Type View.