AdminStudio Inventory and Rationalization 2015 SP1
The Dashboard view of AdminStudio Inventory and Rationalization provides pie and bar charts that provide summary information about your rationalization projects.
Viewing a Summary Dashboard Report of All Rationalization Projects
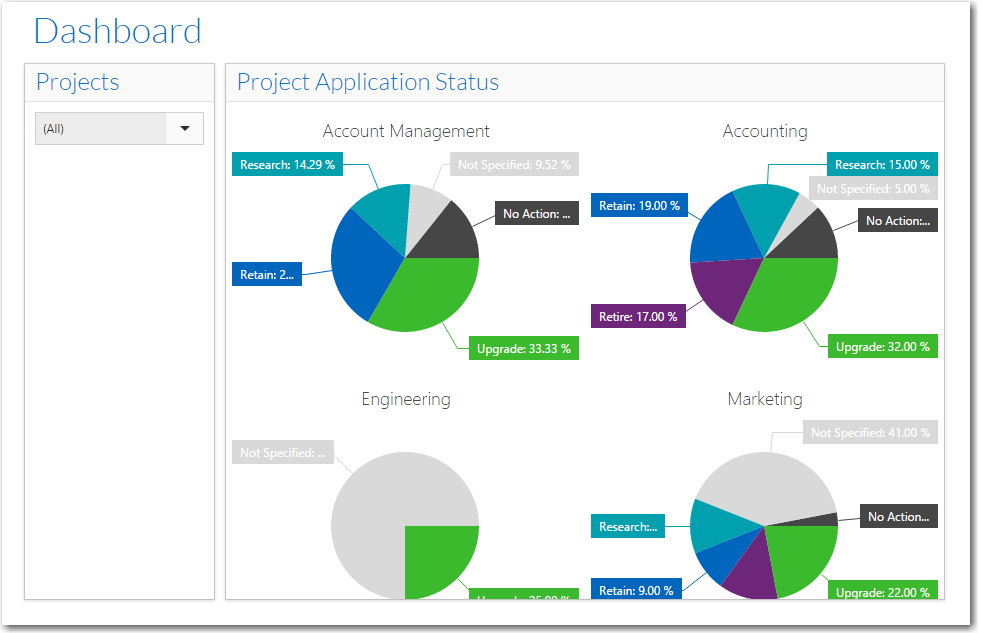
On the Dashboard page of the Home menu, the Project Application Status report is displayed that, by default, provides project status summary information for all of the rationalization projects.
Dashboard Report / All Projects
These pie charts indicates, via count and percentage, how many applications in that project fall into the following Action categories:
|
Action |
Description |
|
Upgrade |
All users of this application (in the specified scope) will be upgraded to this version. |
|
Retain |
In current environment, keep this product version (take no action). In new environment, prepare this application version for deployment in new environment. |
|
No Action |
This product version will not be prepared for deployment in new environment. |
|
Research |
Research is still being performed in order to decide what action to take for this product version. |
|
Retire |
Uninstall this product version from the current environment. If you are upgrading users to a newer version, enter that version number in the Notes column. |
|
Not Specified |
No selection has been made for this application |
Viewing Dashboard Reports for an Individual Project
If you select a project from the Projects list, you will see a larger view of the selected project’s pie chart, along with a Workflow Progress bar chart that indicates the workflow phase that the selected project’s related workflows are currently in.
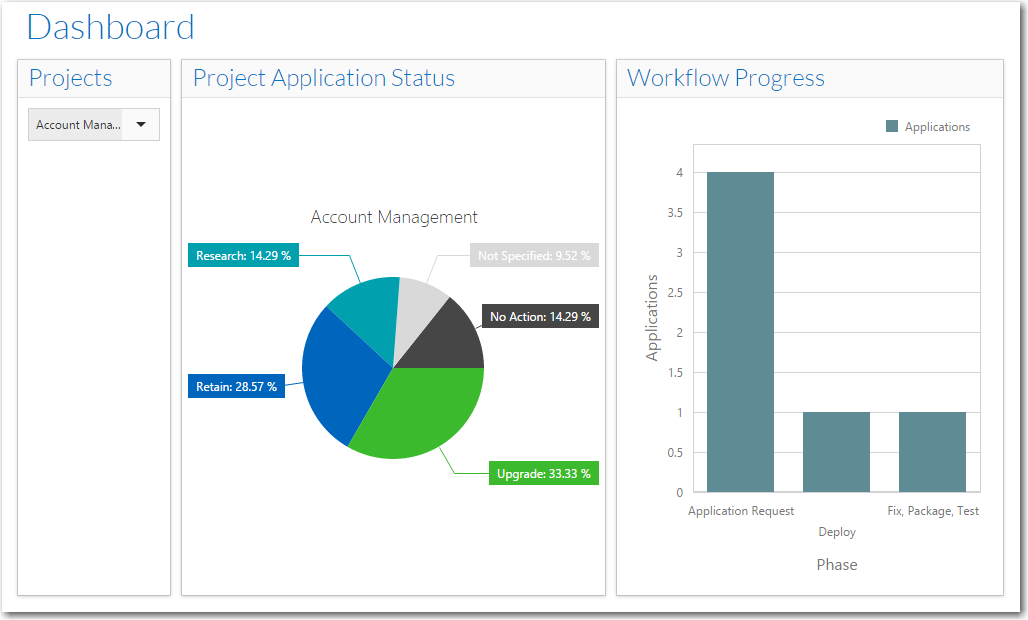
Individual Project on Dashboard Page
Viewing Application Count Information in a Pie or Bar Chart
If you hover over a pie chart segment or a bar in a bar chart, the count of applications in that segment/bar is displayed.
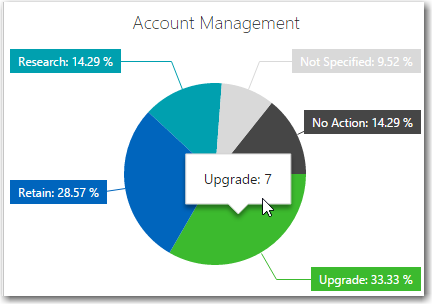
Hovering Over a Pie Chart Segment
AdminStudio Inventory and Rationalization 2015 SP1 Help Library26 January 2016 |
Copyright Information | Flexera Software LLC |