Debug Log
App Portal 2020 R1
When you encounter a particularly complicated issue, one which could be caused by environmental issues and which cannot be easily reproduced on other systems, you may want to turn on App Portal’s debug logging, which can be viewed on the Debug Log view under Site Management > Logs.
Rather than just a log of error messages, a debug log is an exhaustive log of all events—such as actions, methods, stack trace, execution path—and provides a very low level detail of the entire request life cycle of the App Portal web site.
When you turn on debug logging, it is only in effect for the current App Portal user. In other words, if an administrator on Machine A enables debug logging, then App Portal will be logging only requests coming from Machine A.
Important:Because debug logging slows down the system considerably, it should only be turned on when performing troubleshooting, preferably before App Portal is in a production environment.
When debug logging is turned off, the text Debug logging is currently turned OFF is displayed in a red band.
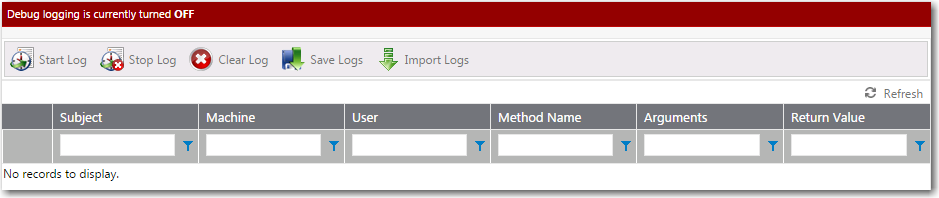
Debug Log View / Logging Off
When debug logging is turned on, Debug logging is currently turned ON is displayed and, if any actions have been taken, methods are listed on the Debug Log view.
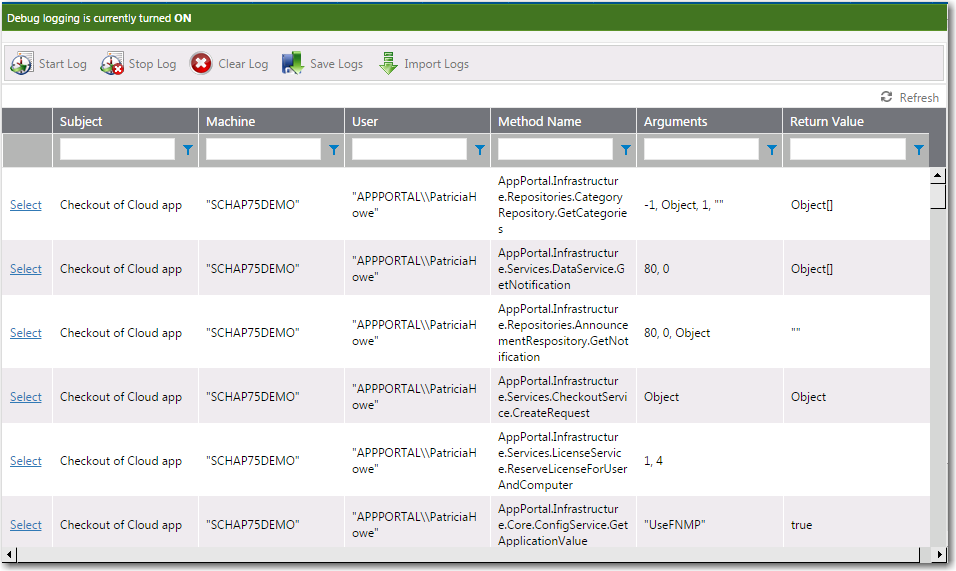
Debug Log View / Logging On
Click Select to view the details of individual method log file.
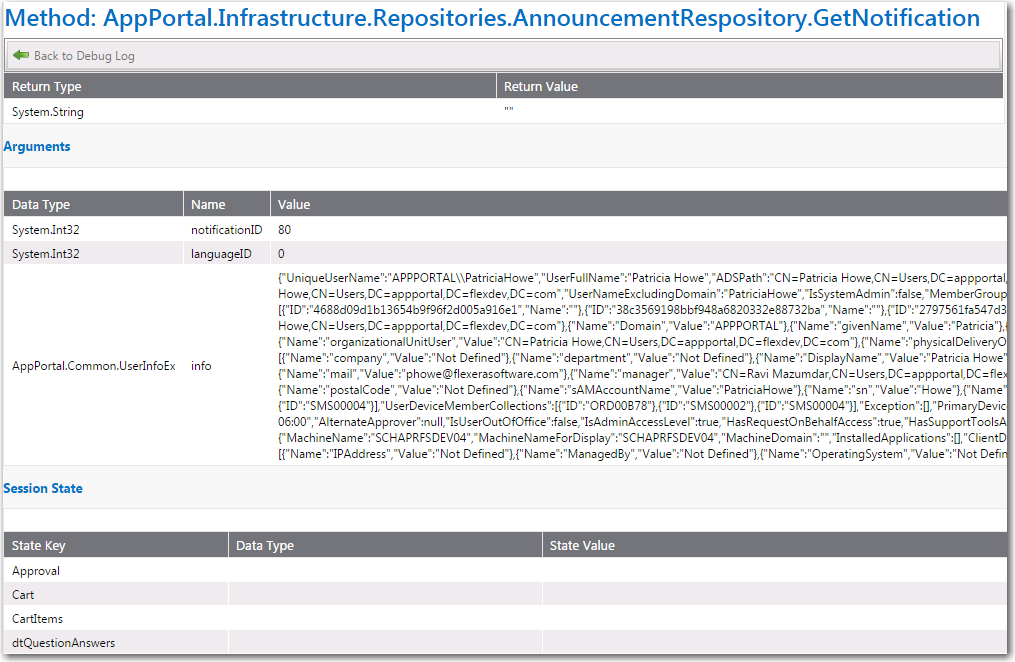
Log File Details of a Method
The Debug Log view includes the following properties:
|
Property |
Description |
|
Start Log |
Click to start debug logging. You will be prompted to enter a title and description of what you are testing. After you have provided that information, the text Debug logging is currently turned ON is displayed. |
|
Stop Log |
Click to stop logging. You are prompted to save the session. |
|
Clear Log |
Click to clear the view so that the last set of logs are no longer displayed. |
|
Save Logs |
Click to save the current log files in a ZIP file so that it could perhaps be sent to product support personnel. |
|
Import Logs |
Click to import a log file in .CSV format. |
|
Select |
Click to view the details of individual method log file. |
|
Machine |
Machine where the logged action took place. |
|
User |
User performing the logged action. |
|
Method Name |
Method that was used. |
|
Arguments |
Arguments that were executed. |
|
Return Value |
Value that was returned from the method. |
Note:For information on the content of log files, see App Portal Logs Reference.
See Also
Viewing Error, Email, Request Lifecycle, and Debug Logs
Creating and Viewing a Debug Log
App Portal / App Broker 2020 R1 Administration GuideAugust 2020 |