Software Reclamation Dashboard
App Portal 2020 R1
App Portal’s Software Reclamation dashboard is now the Home page of App Portal if you have permissions to view it. App Portal’s Software Reclamation dashboard provides tiles and graphs to give you an overview of the progress and status of your software reclamation policies. The tiles at the top of the dashboard display the total reclamation savings over a specified time frame, and also displays the percentage of successful, pending, and failed reclamations in that same time frame. Six graphs are also provided on the dashboard that give granular reclamation details. With all of this information readily available, you will be able to more closely monitor your software reclamation efforts, helping to drive continual software license reclamation and optimization.

Software Reclamation Dashboard Tiles
The following graphs are also provided on the Software Reclamation dashboard below the overview tiles.
| • | Software Reclamation Savings |
| • | Top Software Titles by Reclamation Savings |
| • | Top Software Titles Reclaimed |
| • | Top Software Titles by Reclamation Status |
| • | Software Reclamation Status |
| • | Reclamation Response Breakdown for Top Software Titles |
For related information, refer to:
| • | Viewing the Software Reclamation Dashboard |
| • | Choosing Time Frame for Graph Data |
| • | Selecting Graph Export, Annotate, and Print Options |
| • | Clicking Interactive Graph Legends |
| • | Setting Global Dashboard Options |
| • | Assigning Permissions to View Dashboards |
The Software Reclamation Savings dashboard displays reclamation savings over a specified time frame. To change the time frame, use the Select Time Frame drop-down list or the Start Date and End date fields and click Apply as described in Choosing Time Frame for Graph Data.
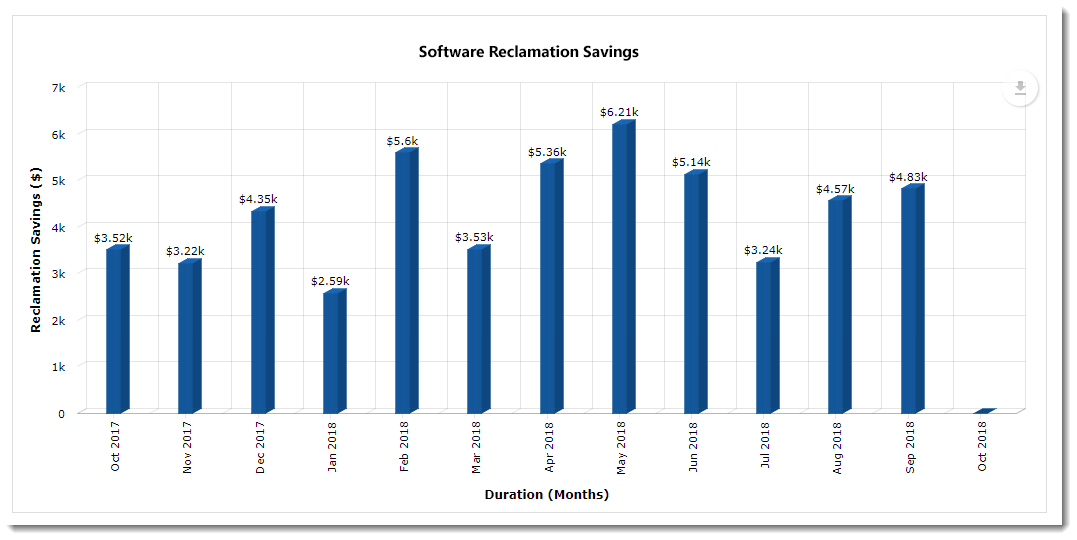
Software Reclamation Savings
Each bar represents the total savings earned for that time frame, with the total cost displayed on the top of each bar. Hovering over any bar provides an enhanced view of the reclamation savings for the specified time frame.
Export, annotation and printing options: At the top right of the graph, there is a down arrow that provides options for exporting and printing, and includes an annotate option that lets you add notes to the graph. For more information, refer to Selecting Graph Export, Annotate, and Print Options.
Top Software Titles by Reclamation Savings
This graph displays the software titles that have generated the most reclamation savings over a specified time frame. To change the time frame, use the Select Time Frame drop-down list or the Start Date and End date fields as described in Choosing Time Frame for Graph Data.
The number of titles displayed in the graph is based upon the number selected in the Software Titles drop-down. Selectable values are 5, 10, 25, 50, 100. The default is 5.
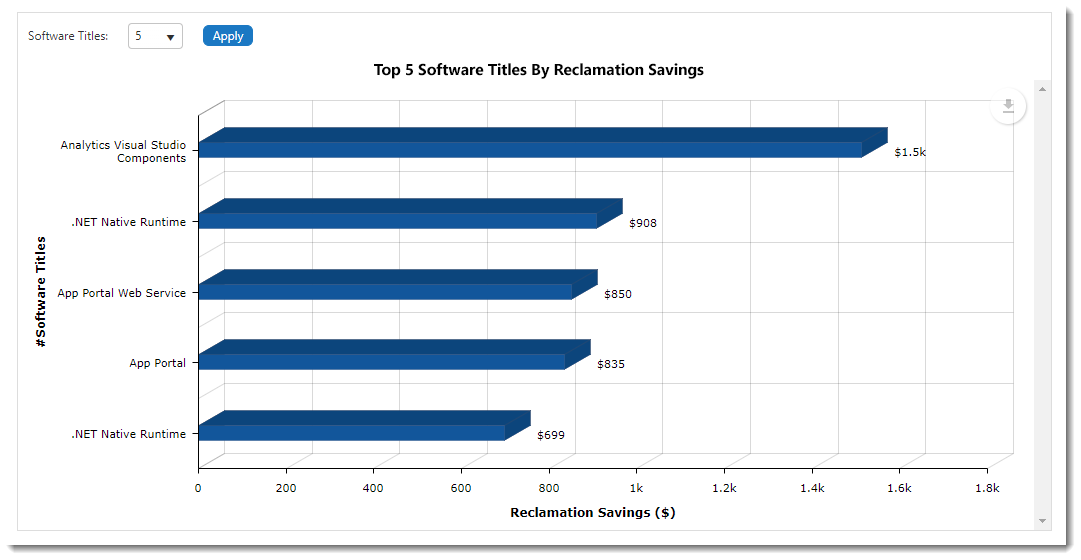
Top Software Titles by Reclamation Savings
Each bar represents the total number of savings earned for that time slot, with the total cost displayed at the far right of each horizontal bar. Hovering over the bar also displays the reclamation savings and application details.
Export, annotation and printing options: At the top right of the graph, there is a down arrow that provides options for exporting and printing, and includes an annotate option that lets you add notes to the graph. For more information, refer to Selecting Graph Export, Annotate, and Print Options.
This graph displays the software titles that have been reclaimed over the specified time frame. To change the time frame, use the Select Time Frame drop-down list or the Start Date and End date fields and click Apply as described in Choosing Time Frame for Graph Data.
Each bar represents the total number of successfully reclaimed software for that time slot, with the total number displayed on the top of each bar. Each bar is divided by colors with each color representing individual software titles. When hovering over a color, the name of the software title is displayed along with the version and the reclaimed count for that duration.
The number of titles displayed in the graph is based upon the number selected in the Software Titles drop-down. Selectable values are 5, 10, 25, 50, 100. The default is 5.
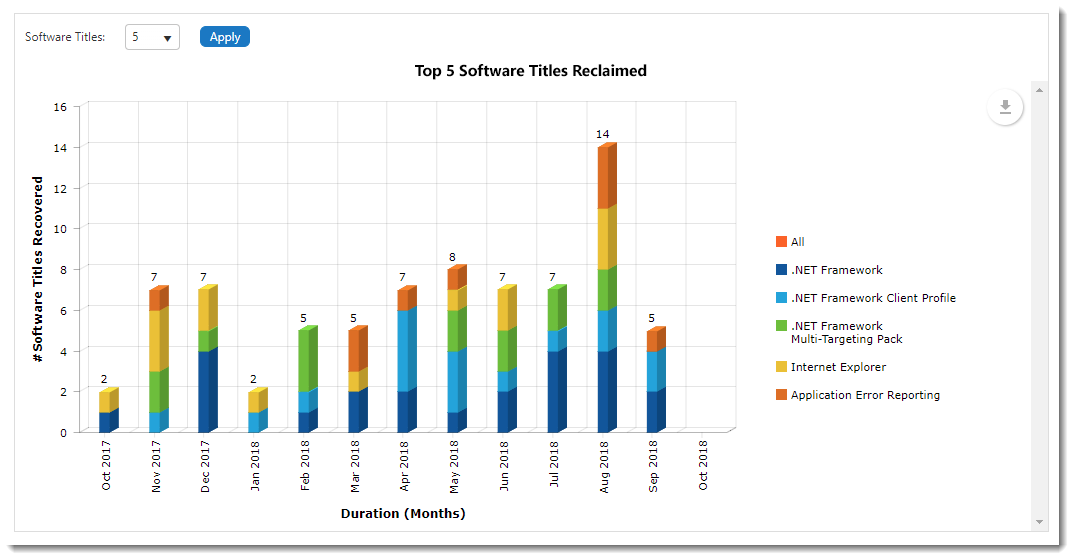
Top Software Titles Reclaimed
Clickable interactive legend: On the right side of the graph, the status legend is displayed, and you can click to deselect and remove any status from the graph. Clicking that status legend again adds it back to the graph. For more information, refer to Clicking Interactive Graph Legends.
Export, annotation and printing options: At the top right of the graph, there is a down arrow that provides options for exporting and printing, and includes an annotate option that lets you add notes to the graph. For more information, refer to Selecting Graph Export, Annotate, and Print Options.
Top Software Titles by Reclamation Status
This graph displays the top software titles that have been processed for reclamation over the specified time frame. To change the time frame, use the Select Time Frame drop-down list or the Start Date and End date fields and click Apply as described in Choosing Time Frame for Graph Data.
The number of titles displayed in the graph is based upon the number selected in the Software Titles drop-down. Selectable values are 5, 10, 25, 50, 100. The default is 5.
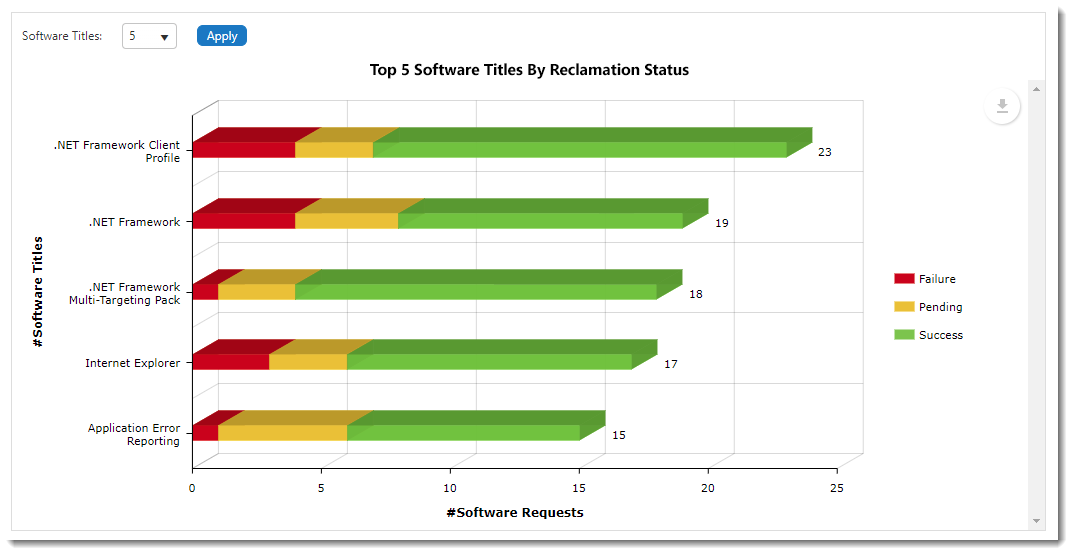
Top Software Titles by Reclamation Status
Each bar is divided into statuses: Failure in red, Pending in yellow and Success in green. Hovering over the color provides the name and version of the software title and the Failure/Pending/Success status count in that duration. At the end of the horizontal bar, the total number of requests placed for the software title is displayed.
Clickable interactive legend: On the right side of the graph, the status legend is displayed, and you can click to deselect and remove any status from the graph. Clicking that status legend again adds it back to the graph. For more information, refer to Clicking Interactive Graph Legends.
Export, annotation and printing options: At the top right of the graph, there is a down arrow that provides options for exporting and printing, and includes an annotate option that lets you add notes to the graph. For more information, refer to Selecting Graph Export, Annotate, and Print Options.
This graph displays the total software reclamation requests that have been placed over the specified time frame, and then groups them by Failed/Pending/Success status. To change the time frame, use the Select Time Frame drop-down list or the Start Date and End date fields and click Apply as described in Choosing Time Frame for Graph Data. The bottom of the graph is categorized by years, months, weeks, or in days depending on the selected time frame.
The number of titles displayed in the graph is based upon the number selected in the Software Titles drop-down. Selectable values are 5, 10, 25, 50, 100. The default is 5. If you change the number selected in the Software Titles drop-down and click Apply, the graph will render that number of bars with a scroll bar added as needed so you can scroll to see all software title bars.
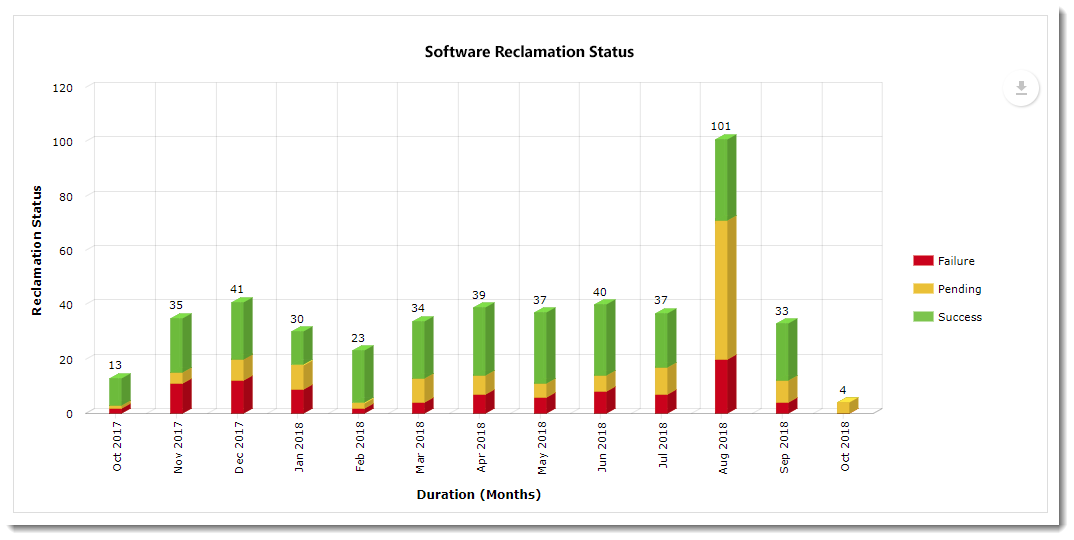
Software Reclamation Status
Each bar on the graph represents the total number of software requests placed over the time frame shown, with the total number of requests displayed on the top of each bar. Each bar is divided by colors according to the status of the software request. Hovering overing over a color on a bar displays the number of reclamation requests for that status and time frame.
Clickable interactive legend: On the right side of the graph, the status legend is displayed, and you can click to deselect and remove any status from the graph. Clicking that status legend again adds it back to the graph. For more information, refer to Clicking Interactive Graph Legends.
Export, annotation and printing options: At the top right of the graph, there is a down arrow that provides options for exporting and printing, and includes an annotate option that lets you add notes to the graph. For more information, refer to Selecting Graph Export, Annotate, and Print Options.
Reclamation Response Breakdown for Top Software Titles
This graph displays the software titles that have been reclaimed over a specified time frame and groups the results by reclamation response (Keep, Not Responded, User Uninstall, and System Uninstall). To change the time frame, use the Select Time Frame drop-down list or the Start Date and End date fields and click Apply as described in Choosing Time Frame for Graph Data. The bottom of the graph is categorized by years, months, weeks, or in days depending on the selected time frame.
The number of titles displayed in the graph is based upon the number selected in the Software Titles drop-down. Selectable values are 5, 10, 25, 50, 100. The default is 5.
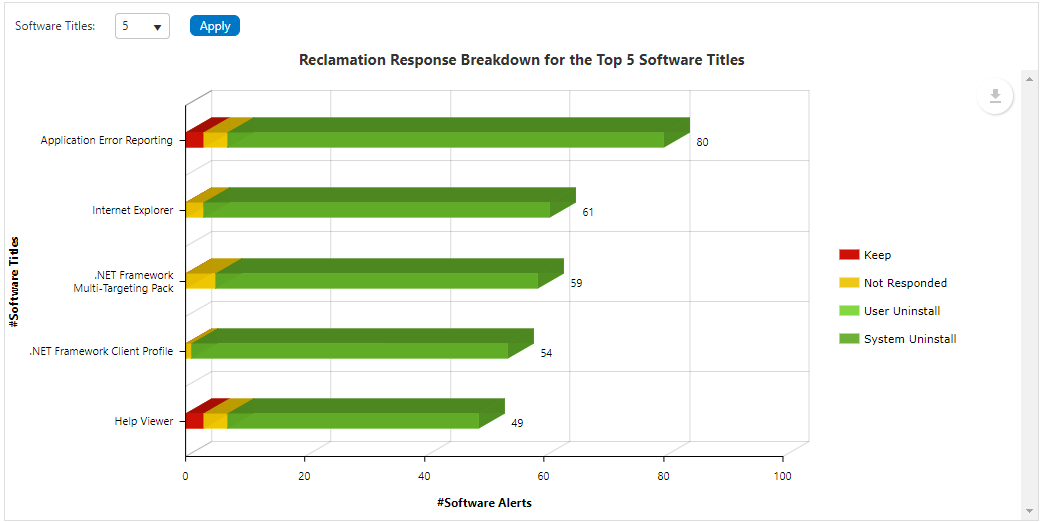
Reclamation Response Breakdown for Top Software Titles
Each bar represents individual software titles sorted by maximum alerts generated. Each color represents the different responses (Keep, Not Responded, User Uninstall, and System Uninstall) taken by a user or system administrator. Hovering over the color displays the name and version of the software along with number of the type of actions taken for the selected time frame. At the end of the horizontal bar, the total number of alerts generated for the respective software is displayed.
Clickable interactive legend: On the right side of the graph, the status legend is displayed, and you can click to deselect and remove any status from the graph. Clicking that status legend again adds it back to the graph. For more information, refer to Clicking Interactive Graph Legends.
Export, annotation and printing options: At the top right of the graph, there is a down arrow that provides options for exporting and printing, and includes an annotate option that lets you add notes to the graph. For more information, refer to Selecting Graph Export, Annotate, and Print Options.
App Portal / App Broker 2020 R1 Administration GuideAugust 2020 |