Dashboard Tab
App Portal 2021 R1
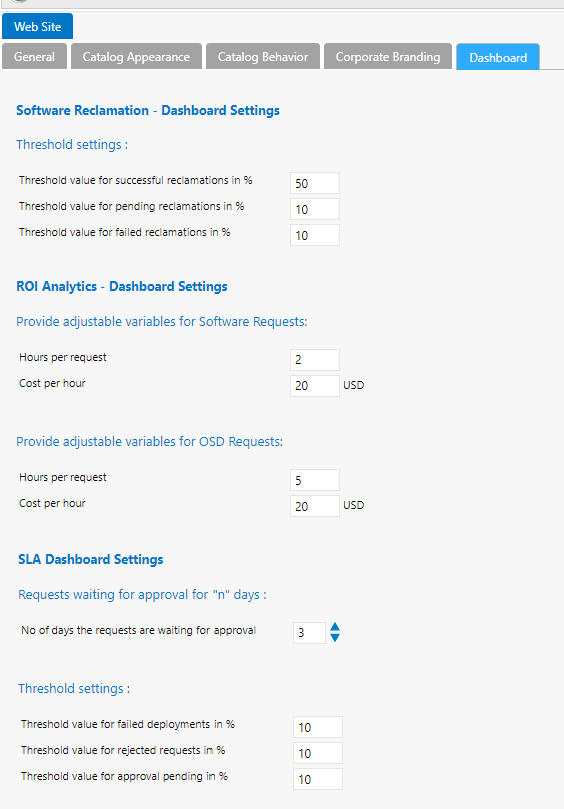
On the Dashboard tab of the Site Management > Settings > Web Site view, you specify options for the Software Deployment ROI, OS Deployment ROI, and SLA Dashboards.
You set dashboard reporting options on the Dashboard tab of the Site Management > Settings > Web Site view.
Settings > Web Site > Dashboard Tab
The Dashboard tab includes the following properties:
|
Property |
Description |
|
Provide adjustable variables for Software Requests |
Enter the number of Hours per request and Cost per hour of a typical software request. |
|
Provide adjustable variables for OSD Requests |
Enter the number of Hours per request and Cost per hour of a typical OSD request. |
|
No. of days the requests are waiting for approval |
Enter the threshold number of days that a request needs to be waiting before it is listed in the Deployment waiting approval for more than n days card on the SLA Dashboard. |
|
Threshold value for failed deployments in % |
Enter the percentage of the total number of requests that need to fail before that category’s card would be displayed in red (instead of gray) in the SLA Dashboard report. |
|
Threshold value for rejected requests in % |
Enter the percentage of the total number of requests that need to be rejected before that category’s card would be displayed in red (instead of gray) in the SLA Dashboard report. |
|
Threshold value for approval pending in % |
Enter the percentage of the total number of requests that need to be awaiting approval before that category’s card would be displayed in red (instead of gray) in the SLA Dashboard report. |