Setting Global Dashboard Options
You set dashboard reporting options on the Dashboard tab of the Site Management > Settings > Web Site view.
To set dashboard options:
|
1.
|
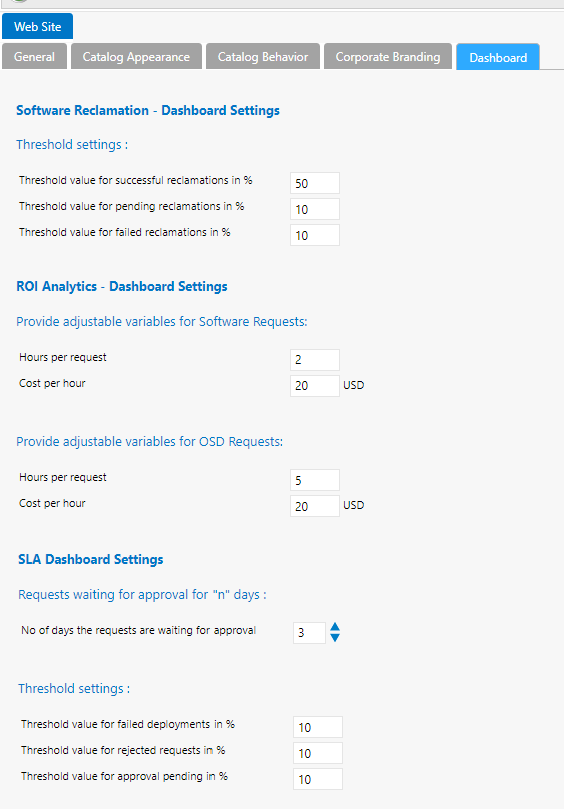
On the Admin tab, open the Site Management > Settings > Web Site view and click the Dashboard tab. |
|
2.
|
Under Threshold settings (under the Software Reclamation - Dashboard Settings section), enter the percentage of the total number of reclamations that need to be reached in the following categories before that category’s card changes color in the Software Reclamation dashboard: |
|
•
|
Successful reclamations—Displays in green if threshold is met; otherwise displays in yellow. |
|
•
|
Pending reclamations —Displays in yellow if threshold is met; otherwise displays in gray. |
|
•
|
Failed reclamations—Displays in red if threshold is met; otherwise displays in gray. |
|
3.
|
Under Provide adjustable variables for Software Requests, enter the number of Hours per request and Cost per hour of a typical software request. |
|
4.
|
Under Provide adjustable variables for OSD Requests, enter the number of Hours per request and Cost per hour of a typical OSD request. |
|
5.
|
In the No. of days the requests are waiting for approval, enter the threshold number of days that a request needs to be waiting before it is listed in the Deployment waiting approval for more than n days card on the SLA Dashboard. |
|
6.
|
Under Threshold settings, enter the percentage of the total number of requests that need to be in one of the following categories before that category’s card would be displayed in red (instead of gray) in the SLA Dashboard report: |