The Dashboard
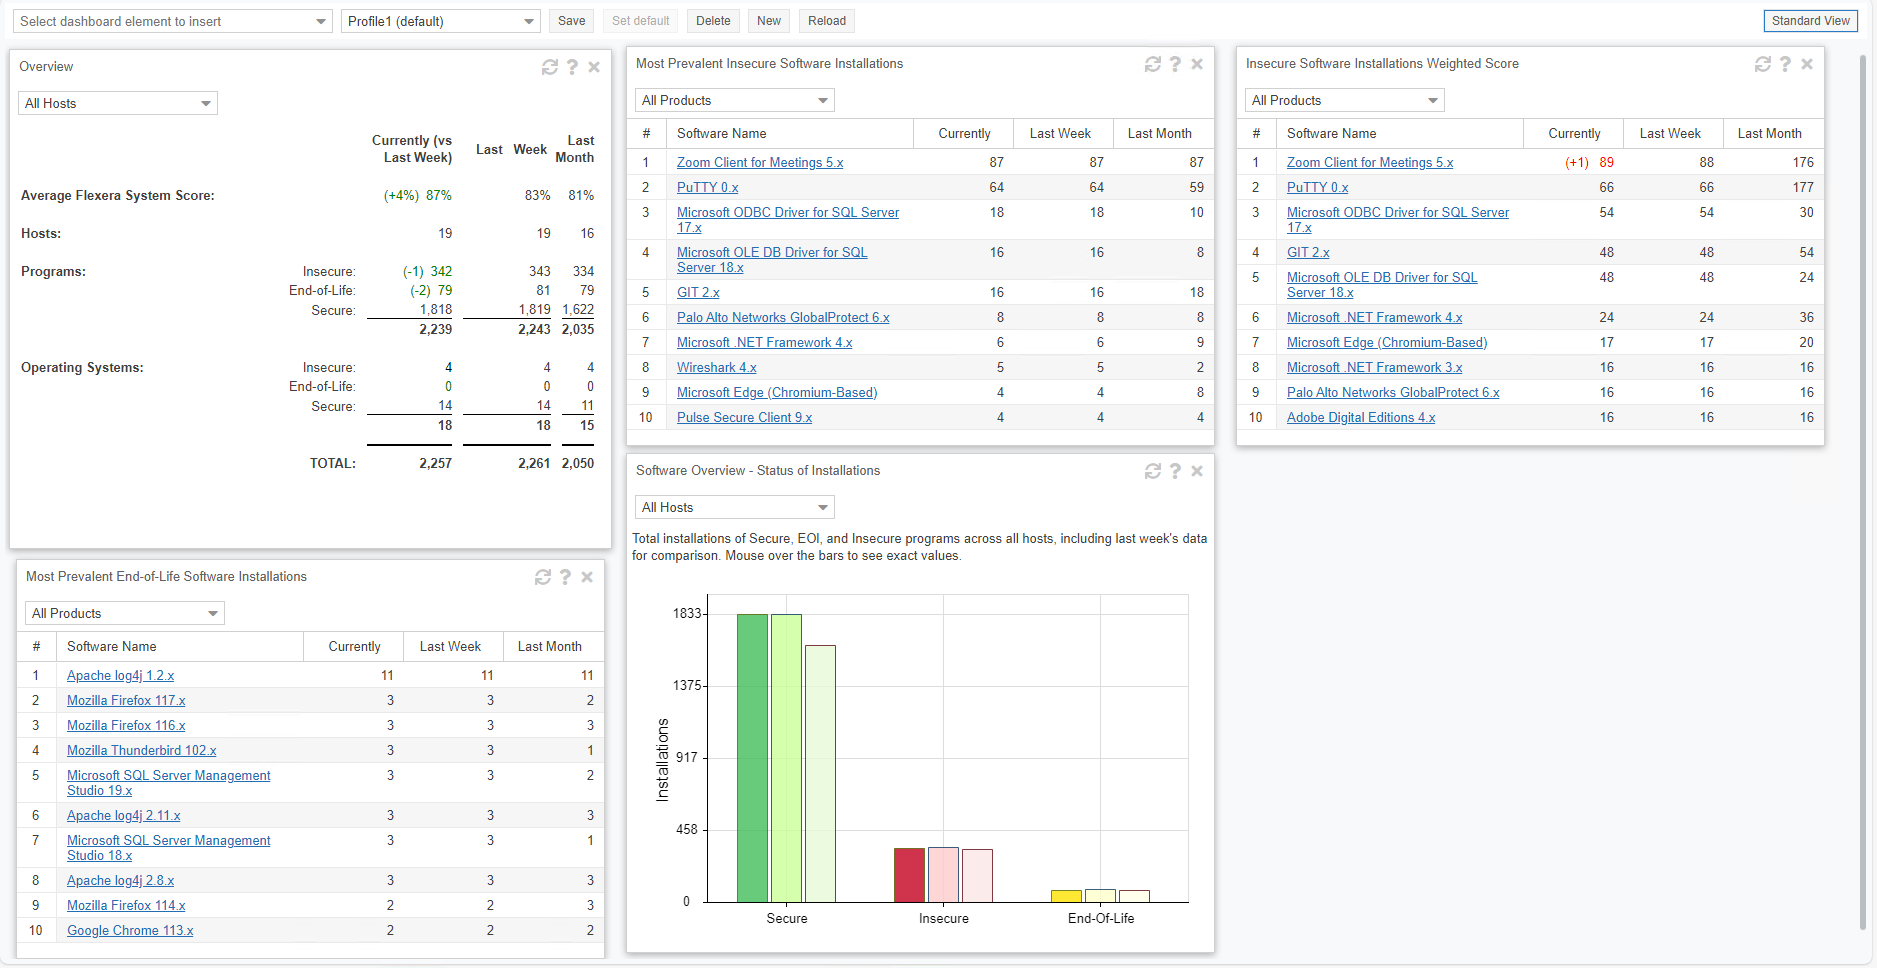
The Dashboard provides an overview of your hosts with the help of various “portlets”. Portlets are a collection of components that graphically display key data and allow you to create profiles which can display a unique combination of portlets.
The first time you login to the Software Vulnerability Manager console the Dashboard page will only display the Overview portlet. Select the Dashboard elements you want to view from the drop-down list on the upper left of the page. You can then either save the profile or, if you have created several profiles, set it as the default profile. You can also delete, add a new profile or reload the current profile view.
Click the Fullscreen View button to view the Dashboard page on full screen.
To exit the fullscreen view, click on the Standard View button.
You can see the Currently (vs Last Week), Last Week, and Last Month data for the respective widgets.
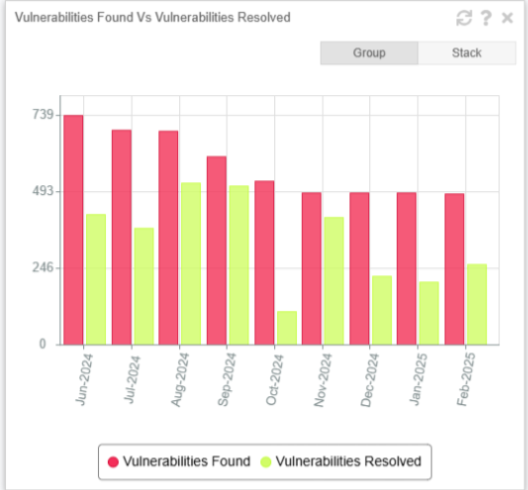
Vulnerabilities Found vs. Vulnerabilities Resolved Widget
Vulnerabilities Found vs. Vulnerabilities Resolved widget use to enhance security visibility and tracking.
Feature Overview:
| • | Displays monthly trend data for total and distinct vulnerabilities identified across environments. |
| • | Tracks the number of vulnerabilities successfully remediated each month. |
| • | Provides insights into active remediation trends, helping teams effectively monitor security efforts. |
This new widget offers a clearer view of vulnerability management progress, enabling proactive risk mitigation across organization.
Tip:Click  in any portlet to refresh the data displayed. You can further filter the data in portlets that allow Smart Group selection.
Tip:Click  in any portlet for more detailed information on the data displayed.
Note:You can only load one unique portlet at a time.
Tip:You can toggle between Full screen and Standard views and click Export to download a PNG image of the current Dashboard Profile.