Using the Administration Console
Data Platform
Once you add a process to Data Platform Normalize, the Administration Console splash screen is replaced by the Data Platform Normalize main screen, an example of which is shown in Data Platform Normalize Console Panels. This screen is divided into the following panels:
| • | Data source: Use this panel to add a data source to a process. Added data sources will display in this panel, as well as groupings of combined data sources that share schedules and other settings. |
| • | Process: Use this panel to either run a Data Platform Normalize process on demand or to schedule the process to run at a later time. |
| • | Results: Use this panel to view statistics and access results of your most recent normalization. |
Data Platform Normalize Console Panels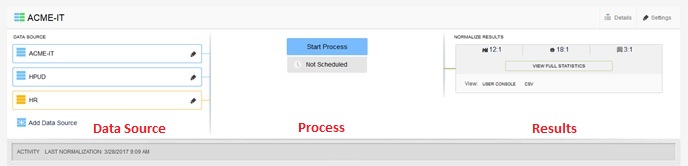
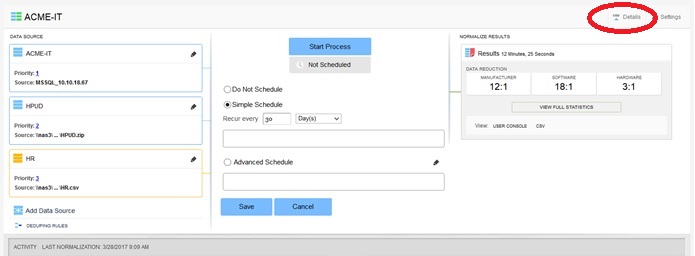
You can view additional information about Data Source, Process, and Results by clicking the Details icon above the Results panel, as shown in the following image:
Note:Platform UI detects the configuration file (Norm.Configuration.config) to see if Tier 1 & 2 software statistics are turned on or off. By default, it is set to ‘false.’ Hence, users do not see Normalize statistics on Admin Console page. Customers can still turn this functionality on by editing Norm.Configuration.config and setting values for "StatsKeywordExec" and "StatsKeywordAddremove" to ‘true’ if they want to see Tier 1 & 2 software statistics on both the Normalize Results section of the Admin Console page and the Full Statistics pop-up window.