Creating a New Interactive Report
When you first open Interactive Report, the categories and fields associated with the data source you selected are displayed in the left pane under Data. You can immediately begin to build the report by clicking and dragging fields onto the report canvas. Interactive Reports provides you with live rendering of your report which means that you can see the report layout as you build it. Formatting changes can be made on the fly.
Follow the instructions below to begin creating a new report.
| 1. | To add your first column, click and drag a field onto the report canvas. |
The field becomes a column in your report. Repeat this step until you have all the columns of your report in place.
If you want to make sure subsequent columns appear in correct order, look at the vertical green line that appears to the right or left of the first column. If you drag the selected field to the left and the green line appears, the new column will appear to the left of the original column. If you drag the selected field to the right and the green line appears, the new column will appear to the right of the original column.
Note:Do not worry if your column does not get placed correctly on the report canvas. To correct a placement, drag the report header to the appropriate location. Click the undo/redo buttons in your toolbar if you make a mistake.
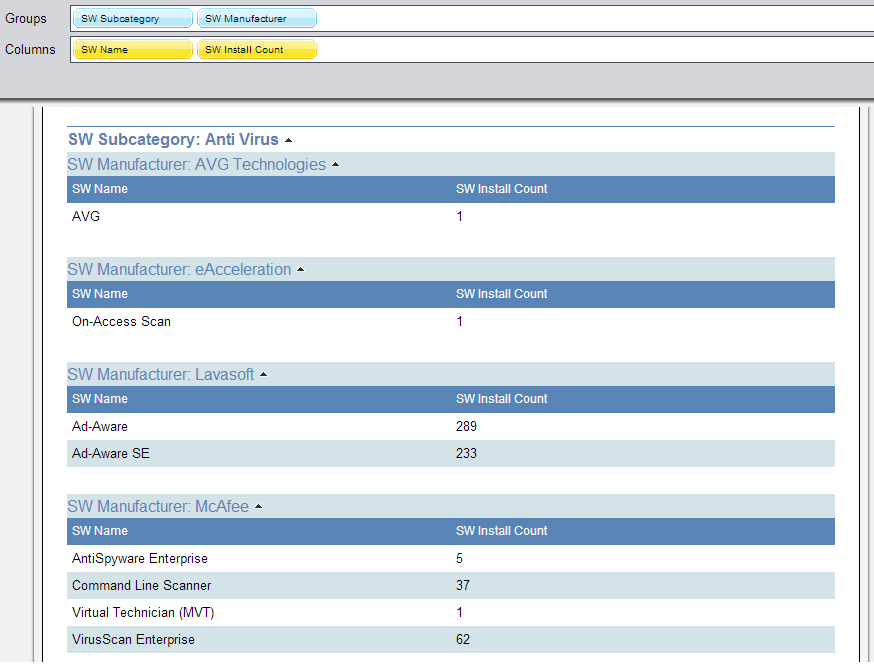
| 2. | If applicable, add one or more groups to your report. The grouping feature in Interactive Report allows you to group the data in your report by one or more fields. For example, you could group your software data by Category, by Manufacturer, or both. If the field you want to group by is already a column in your report, click the column header and drag it up above the other headers in your report. Release the mouse button when the horizontal green line appears. You can also drag a field from the right pane and place it above the report headers to create your group. |
Sometimes you need to group the data in your report by more than one field to get the data in the order you want it to display. An example of adding more than one group is shown below. The report data grouped by SW Category first and then by SW Manufacturer. To nest a group, drag the field or column header beneath the original group.
Interactive Report Grouping
Notice the small arrows next to the group name. In this example, the arrows point up indicating that both groups are sorted in Ascending order. To change the sort order to Descending, click the arrow next to the group name or make the change, under Group Sorting in the right pane.
You can save your report at this point or continue customizing it.