Creating a Static List of Options
You must have a data table or chart that contains at least one parameter for your filter control to function correctly. When you create a static list, you define a static list of options to present to the dashboard user. Each option consists of a display name that appears in a drop-down list and a value that is used to restrict the data query in the filter toolbar as shown in the example below:
Follow the instructions below to create a static list:
| 1. | In the dashboard page, under General Settings, select Prompts. |
The Prompt Pane appears on the right. No filters are listed if this is the first time you are assigning filters.
Prompt pane
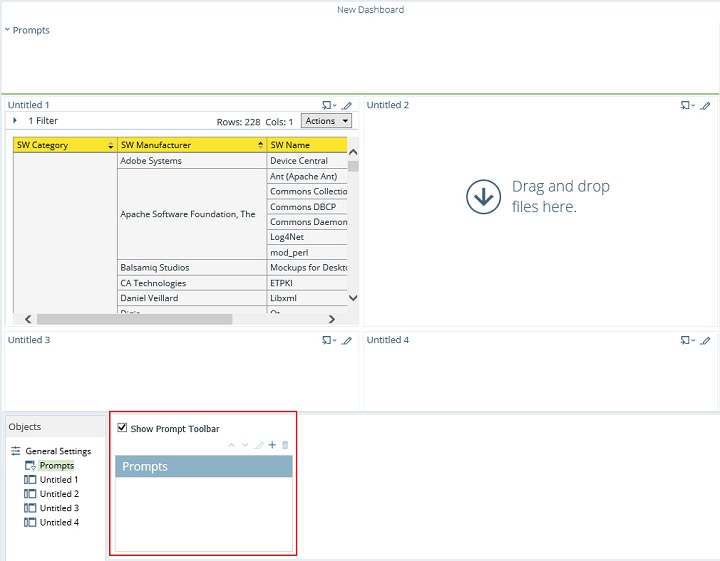
| 2. | To display a filter toolbar to users of the dashboard, enable Show Prompt Toolbar. |
A placeholder for the filter toolbar appears at the top of the dashboard.
| 3. | Click  (Add) to add a filter. (Add) to add a filter. |
The Prompt dialog box appears.
| 4. | Click on an icon to select your Prompt type. In the example above, the  (Drop Down) control was used. (Drop Down) control was used. |
| 5. | Ensure that Static List is selected under Type. Static List is the default selection. |
| 6. | Click  (Add). (Add). |
The List Value dialog box appears.
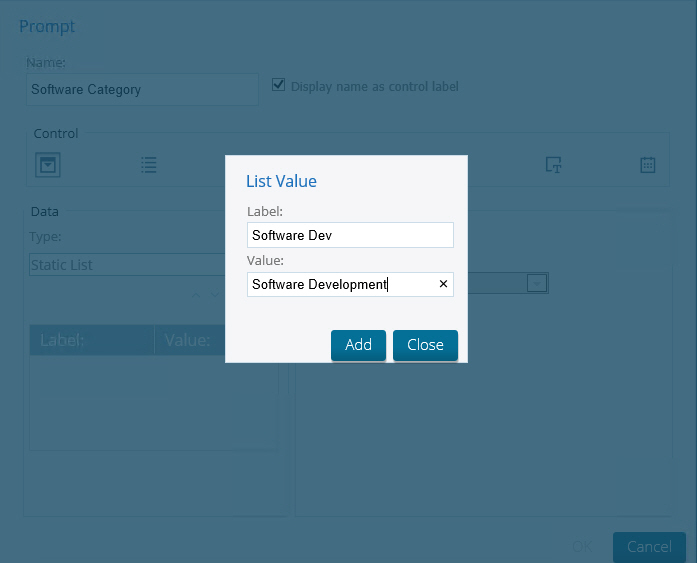
| 7. | In the List Value dialog box, enter the label and a value for the first option in the list. The label is the option that is visible to dashboard users; the value is passed as the parameter's source value. |
List Value Dialog
| 8. | When you are done adding labels and values, click Close to exit the List Value dialog box. |
Added Labels and Values
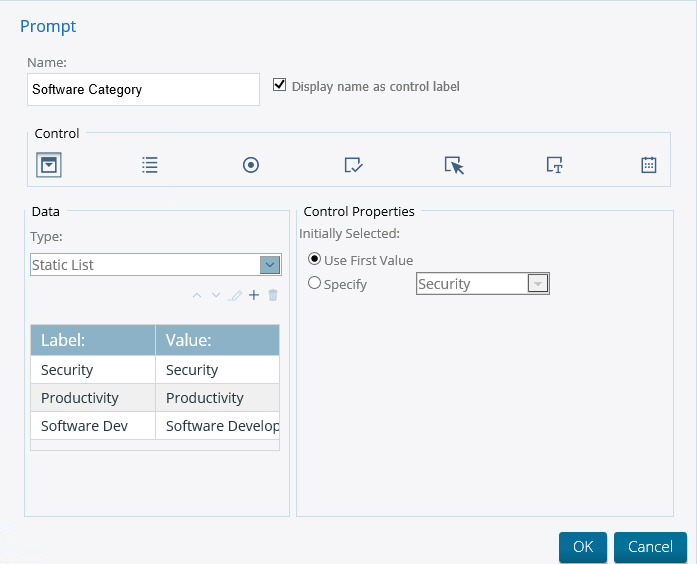
| 9. | Optionally, in the Prompt dialog box you can change the control properties (filter option) that will appear first in the filter control selecting another label from the list under Use First Value. |
| 10. | In the dashboard, select your chart or data table. Click the Parameters tab and choose another Source for the parameter from the list. That source should be the name of your filter control; in this example, Software Category. |
Changing the Source Value
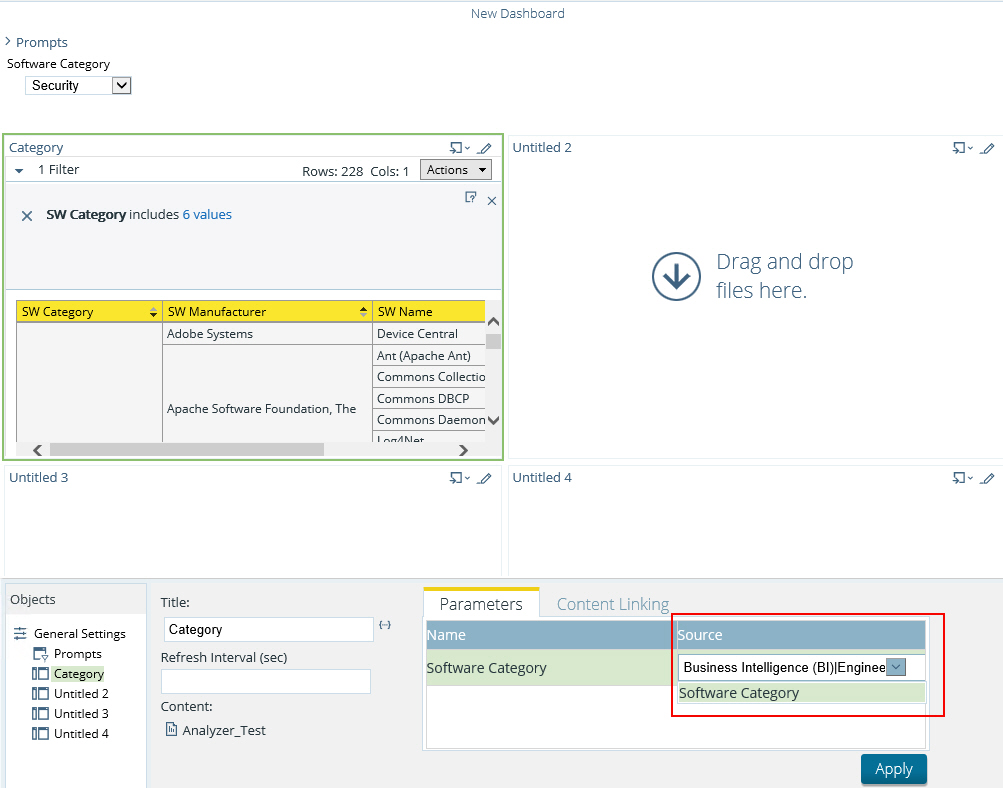
| 11. | The original default value (Source) for the {Software Category} parameter was Business Intelligence but for the filter to display correctly, the Source was changed to Software Category in the dashboard so that the filter control could drive the content in the data table. |
| 12. | Click Apply to add the filter controls to the dashboard. |
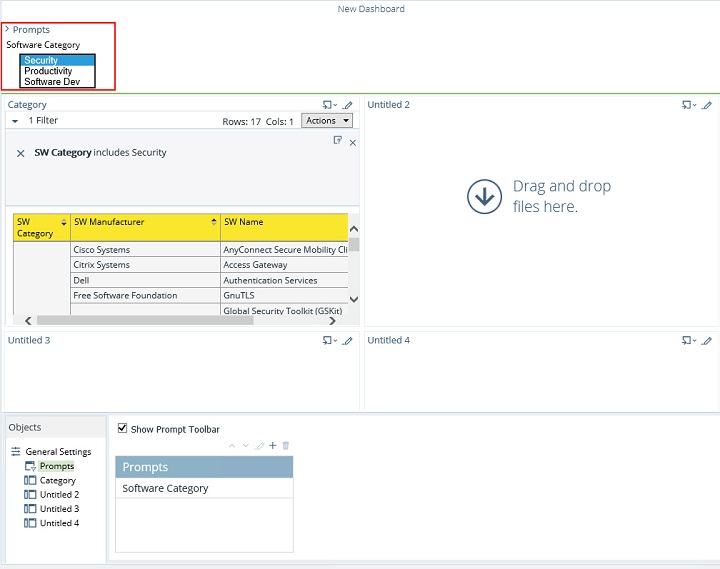
The filter options are displayed to the dashboard user when viewing the data table. Select one of the filter options to apply the filter to the report.
Filter prompts added to dashboard
| 13. | Save your dashboard with the new filter prompts you created. |
Creating a Metadata List
You must have a data table or chart that contains at least one parameter for your filter control to function correctly. When you create a Metadata List, you are defining a query to retrieve a list of display names and corresponding values from a metadata data source.
Creating a Metadata List
| 1. | In the dashboard page, under General Settings, select Prompts. |
The Prompt Pane appears on the right. No filters are listed if this is the first time you are assigning filters.
| 2. | To display a filter toolbar to users of the dashboard, enable Show Prompt Toolbar. |
A placeholder for the filter toolbar appears at the top of the dashboard.
| 3. | Click  (Add) to add a filter. (Add) to add a filter. |
The Prompt dialog box appears.
| 4. | In the Prompt dialog box, enter a Name for your filter. |
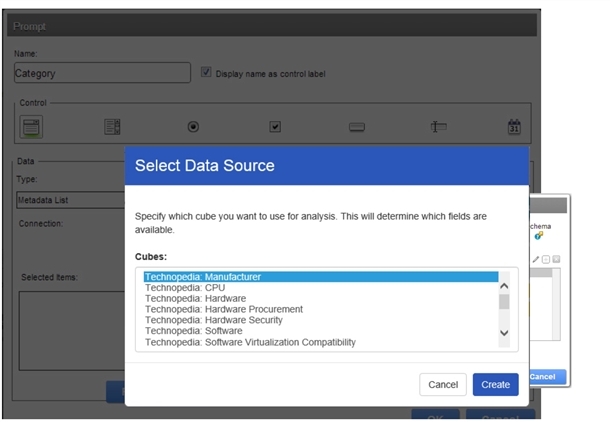
| 5. | Under Data Type, select Metadata List. |
| 6. | Click Select to choose the data source that contains the content you need to set options from the drop-down list and click OK. |
The Query Editor opens.
| 7. | In the Query Editor, build a query to select either a single column (that represents both a name and a value), or two columns representing the display names and corresponding values. |
Note:If a single column query is defined, the values of that column will be used for both the display names and the values.
| 8. | Click OK to exit the Query Editor. |
Your options appear under Selected Items in the Filter Properties dialog box.
| 9. | Under Control Properties, enter a Default Label/Value for the initially selectedoption in your filter control. |
Entering a Default Label/Value
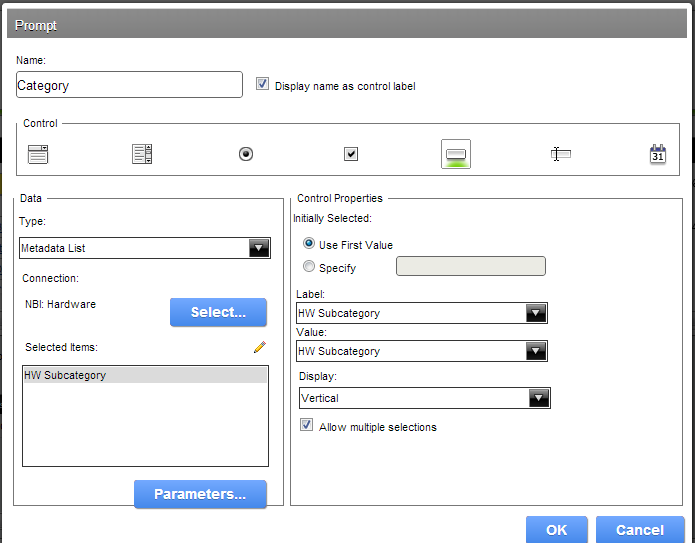
| 10. | Select a Label to display in the filter control; this is the user-friendly name that users will see in the dashboard. |
| 11. | Select the Value; this is the value in the database that is associated with the Label you selected in the previous step. |
| 12. | If applicable, select your Display type from the list. |
Note:Some filter controls allow you to choose the position of your filter options. If you have a long list of options, for example, a list of cities, options may not appear correctly in the user console unless you change the Display type to Horizontal.
| 13. | Click OK. |
The list of values appear in the prompt toolbar in the dashboard.
Linking Dashboard Filters to Analyzer Parameters
This process only applies to dashboards that include parameterized Analyzer reports. You must have an Analyzer report with a parameter in it in order to proceed.
The instructions below explain how to parameterize an Analyzer report.
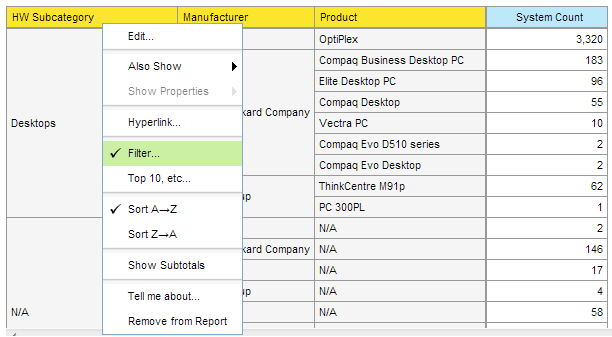
| 1. | In the Analyzer report, select a field in your report to which you want to link; then, right-click and choose Filter. |
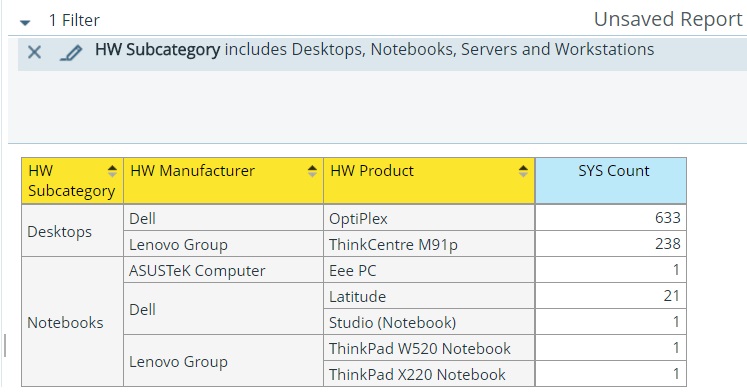
In the example below, data will be filtered by HW Subcategory.
Selecting a Filter
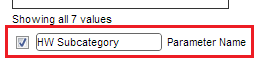
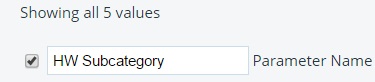
| 2. | In the Filter dialog box, enter a name for the parameter in the Parameter Name text box and click the check box to enable it. |
Entering Parameter Name
| 3. | Select the values you want associated with the parameter. Use the arrows to add values to the box on the right. |
Selecting Values to Associate with the Parameter
| 4. | Click OK to exit the Filter dialog box. |
| 5. | Save your Analyzer report. |
In the upper left corner of the report, you can see that a filter is in use. Click (Edit) to edit your filter; click
  (Delete) to delete the filter.
Filter in Use
| 6. | Create a dashboard and drag the Analyzer report into a panel. |
The name of the parameter appears in the lower portion of the dashboard under Parameters.
| 7. | Add a prompt to the dashboard based on the parameter you created in your Analyzer report. |
The prompt appears in the dashboard.