Setting Chart Options
The Set Chart Options allow you to define the chart display (colors, legend, number of charts per row, bullet styles, and more). To access the Chart Options dialog box, click the Report menuin the upper-left and choose, Chart Options.
Report menu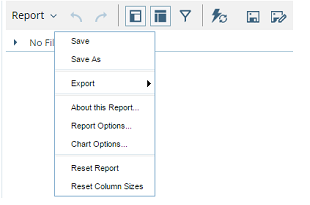
Chart options are defined below:
|
Option |
Description |
|
Background |
Fill type defines the background color of the chart and the specific fill colors used. A Gradient will result in a gradual color transition in the fill color. Choose the color you want from the available color pickers (Fill Color, End Color) You can select not to have a fill color (None), or select a single background color (Solid). |
|
Labels |
Allows you to select a font type, size, formatting, and color of the labels in your chart. |
|
Axis |
Allows you to adjust the axis range. When set to Auto Range, the chart will scale based on the data. If you have a time series chart, you may want to set the range manually so that figures, (not close to the 0 axis), display correctly; (see image below). Select a Scale option to manage instances where numeric values in a chart are so long that they affect the display. |
|
Option |
Description |
|
Show Legend |
Allows you to enable to disable the legend display |
|
Position |
Allows you to select the placement (Top, Right, Bottom, Left) of the legend on the chart |
|
Background Color |
Allows you to select a background color for the legend |
|
Font |
Allows you to set the font type, size, format, and color associated with your legend |
|
Option |
Description |
|
Line Charts |
Allows you to set the Bullet Style for points on a line chart and assign Line Width |
|
Multi-Charts |
Allows you to define the number of charts that display when using the Multi-Charts feature |
|
Domain Limit |
Allows you to limit the number of plot values that display in a chart. |