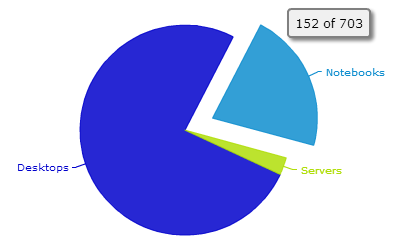
If you are comparing parts of a whole, consider using a pie chart. Key words associated with charts include, portion, share, and percentage. If for example, you want to demonstrate the proportion of the company's budget spent on health insurance, use a pie chart. To make the chart easier to read limit the number of slices to five. Pie charts can also be exploded, which means certain slices are pulled away from the remainder of the chart for emphasis.
Pie Chart Example
BDNA Data Platform 5.5 User Console Help Library02 August 2016 |
Copyright Information | Flexera |