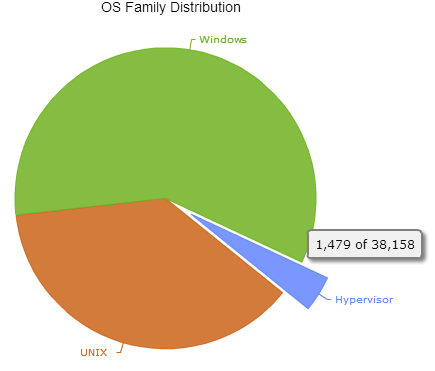
A pie chart gives dashboard consumers an immediate visual clue of the relative sizes of the shares of a whole. Categories are represented by individual slices. The size of the slice in a pie chart is determined by the value.
Working with Pie Charts
BDNA Data Platform 5.5 User Console Help Library02 August 2016 |
Copyright Information | Flexera |