Filtering Insights by Measure Values
Note:
In Data Explorer, you can filter your data by values of the measures used in your insight. For example, you can display data that correspond to a specific measure value, fall within or outside of a certain interval, or are greater than the specified value.
The filter by measure value is available in all insights with at least one attribute or date (in other than the Measures section), except Headlines, and is applied after the date and attribute filters.
You can use any local measure (that is, any measure already in your insight) to filter by its values.
The filter is also applied when you add the insight to a KPI Dashboard. However, you can edit the filter settings only in Data Explorer.
To configure the Measure Value filter:
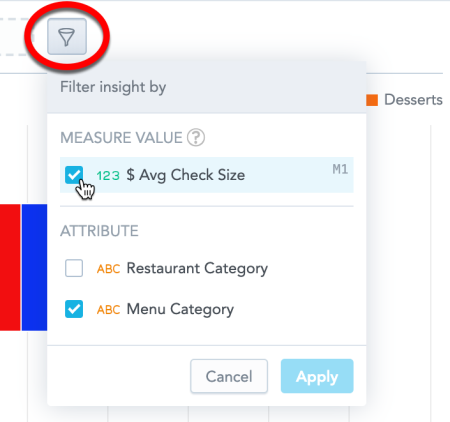
| 1. | In the insight you want to filter, click the filter bar icon. |
| 2. | In the Measure value section, select the measure you want to use for filtering and click Apply. Data Explorer adds the measure to the filter bar. |
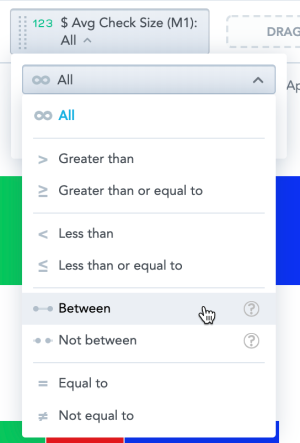
| 3. | Click the measure in the filter bar and select one of the logical operators. |
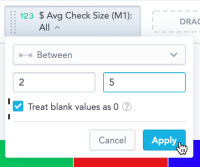
| 4. | Specify the values for filtering and click Apply. |
You can type numbers, decimal point/comma, and thousand separators based on your regional number format settings.
Note:If your insight displays data as percentages (options Stack to 100% or Show in %), you must use the original values when specifying the filter, not the percentages.
Data Explorer now filters your data according to your configuration. Note:
| • | When you remove a measure used to filter the insight, Data Explorer removes the filter as well. |
| • | If you remove all attributes and dates from your insight, the filter by measure value is removed. |
| • | When you filter by measure value in tables, you cannot aggregate data using the Rollup (Total) function. If the data is already aggregated and you add the filter, the Rollup (Total) function is removed. For details about aggregation functions in tables, see Pivot Tables. |
| • | If you filter by measure value, you cannot open the insight as a report. The Open as Report option is disabled. |
| • | If you export your insight, the file will include the filtered data (XLSX, CSV) and the filter specifications (XLSX). |
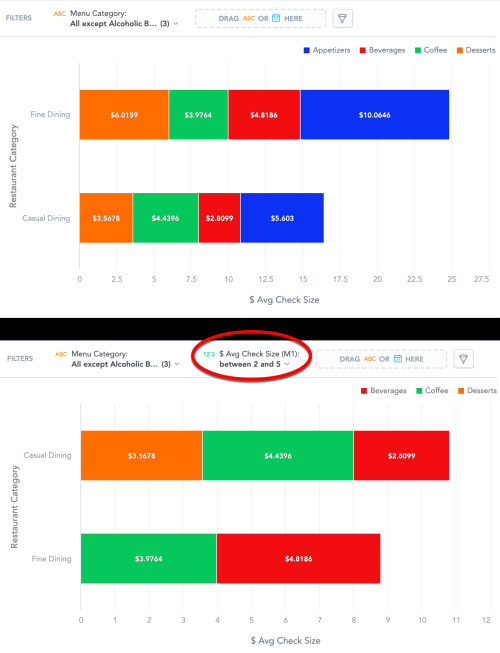
The following image shows an insight before and after the filtering specified above.
Filtering Null Values
Null values means that there are no data available. Null values display as - (dash). It differs from the 0 (zero) values.
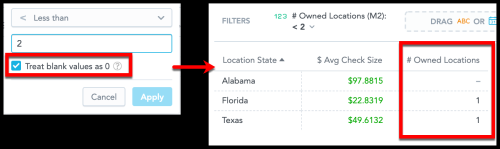
When you filter your data and the target values include zero, you can decide if the values that are null are included in the final filtered insight by selecting the Treat blank values as 0 checkbox.
Example
In the following example, the insight displays Average Check Size and the number of Owned Locations in different states and is filtered to display only the states with fewer than two owned locations.
The first image has filter with option Treat blank values as 0 selected and shows also states with no owned locations (null values).
The second image has filter with the option deselected and shows only states with at least 1 location owned.