Treemaps
Note:
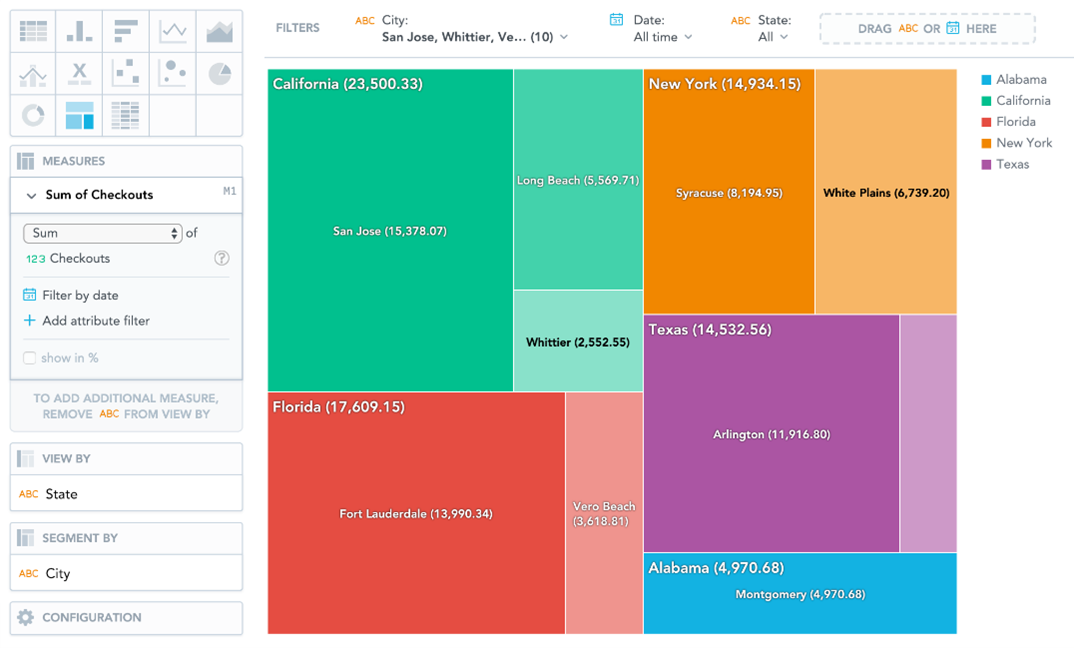
Treemaps display your data hierarchically as nested rectangles. Treemap are useful for comparing proportions within the hierarchy.
Treemap have the following sections: Measures, View by, Segment by, and Configuration.
| • | In Treemap, you can also: |
| • | Display the values as a percentage. You must add Dates or Attributes to the View by section. |
| • | Segment the Treemap by attributes. The Treemap shows the attributes as different shades of a color. To add attributes to the Segment by section, you must have only a single item in the Measures section. |
| • | Slice your data by attribute or date. You must add Date or an Attribute to the View by section. |
For information about common characteristics and settings of all insights, see Insight Types.