Amazon Web Services (AWS) Reserved Instance Coverage
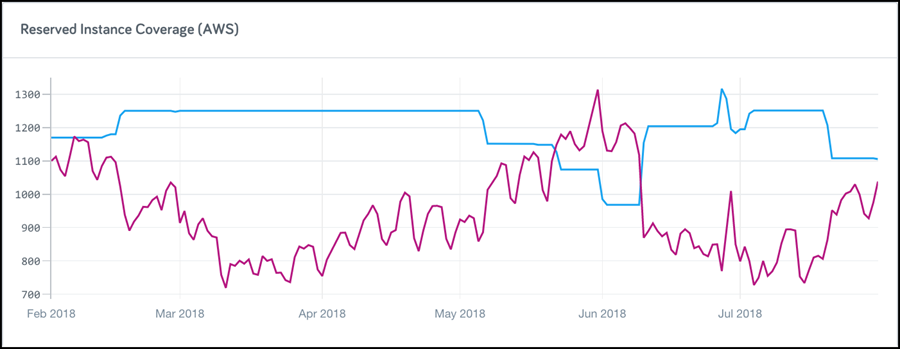
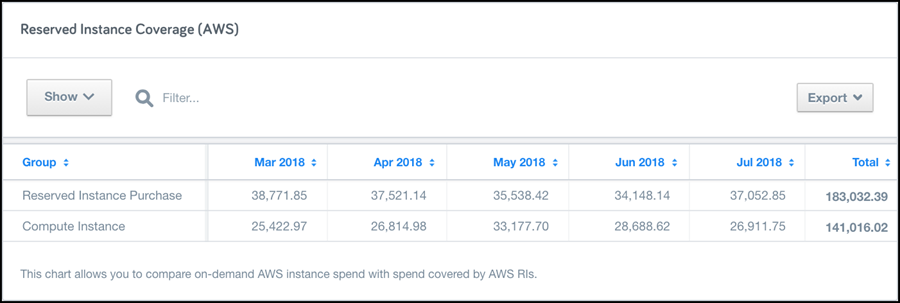
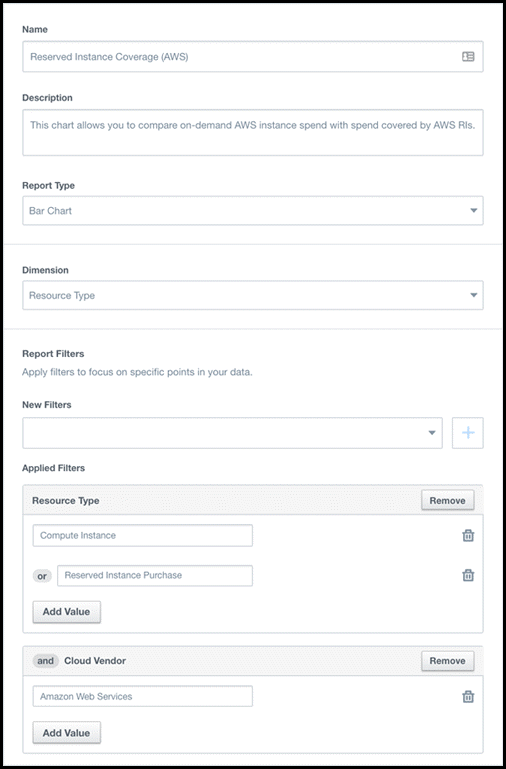
To set up these AWS RI Coverage reports, use a bar chart to see monthly data and a line chart to see daily data. Simply change the report type between bar, line, or table to see these variations.