Tier Usage Report
The Tier Usage report displays the daily peak usage for a tier, and optionally calculates the cost of the usage (calculated using either the peak or the second-highest peak). This report can be used for billing purposes.
Data is presented in a list that shows costs, followed by a chart and list that shows peak usage for all the days in the specified time period. You can drill through to the hourly report by clicking one of the dates in the lists, which will launch the hourly report for that day, using the same options.
Options for configuring the report include:
|
•
|
Calculate cost based on peak or second-highest peak, or not at all. |
|
•
|
Interval for the report, either the Previous Month, Previous Quarter, or a custom data range (where you specify start and end dates). |
|
•
|
Select the organization to report on (it is always the top level of the organization that is reported against). |
|
•
|
Select the tier to report on. |
|
•
|
Optionally include breakdown by features—there are three options: Tier data only, Feature data only, or Tier + Feature data. |
To run the Tier Usage report:
|
1.
|
From the Reporting tab, under the Flexera Analytics section, click Cognos Reporting. |
|
2.
|
In the Cognos Connection pane, click the FlexNet Manager Suite folder. |
|
3.
|
Click the FlexNet Manager for Engineering Applications Reports folder, then click the Tier Reports folder. |
|
4.
|
In the list of reports, click Tier Usage Report. |
|
5.
|
Specify the report settings. Click “Description (show/hide)” to view setting descriptions. |
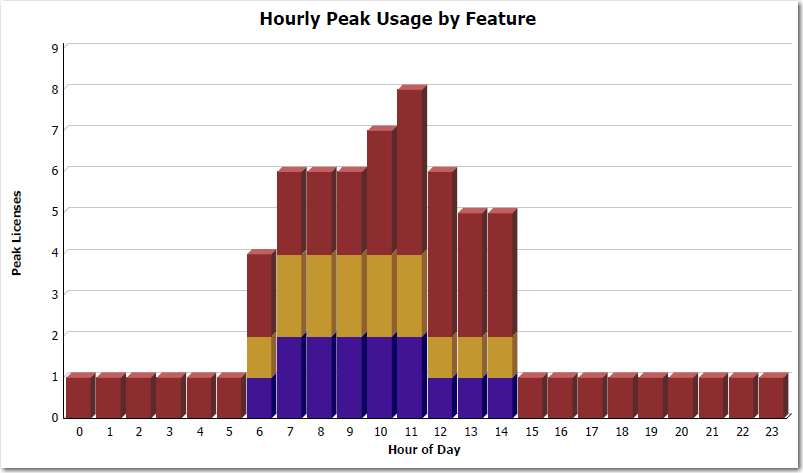
Part of the Tier Usage report, showing Hourly Peak Usage by Feature.
See Also
Tiers
Reporting on Tier-Based Usage