Token-Capability Peak Usage Report
This report can be run against hourly, daily, and monthly usage data. It displays a chart and a list, both of which show—over time—the counts of each capability that contribute to the parent tokenized feature’s peak for that time period. The sum of these capability counts equals the feature's peak usage. The data can be displayed in two different formats—a horizontal list, suitable for a small number of data points, and a vertical list, which is better for larger amounts of data.
Options for configuring the report include:
|
•
|
Time Interval—Hourly, Daily, or Monthly |
|
•
|
Organization—Specify the organization for which you want to display usage data. |
|
•
|
Feature—The list contains only the features that are broken down into capabilities. |
|
•
|
List format—Specify how the data should be displayed in the report. You can change this setting from the main page of the report. |
To run the Token-Capability Peak Usage report:
|
1.
|
From the Reporting tab, under the Flexera Analytics section, click Cognos Reporting. |
|
2.
|
In the Cognos Connection pane, click the FlexNet Manager Suite folder. |
|
3.
|
Click the FlexNet Manager for Engineering Applications Reports folder, then click the Token-Capability Reports folder. |
|
4.
|
In the list of reports, click Token-Capability Peak Usage Report. |
|
5.
|
Specify the report settings. Click “Description (show/hide)” to view setting descriptions. |
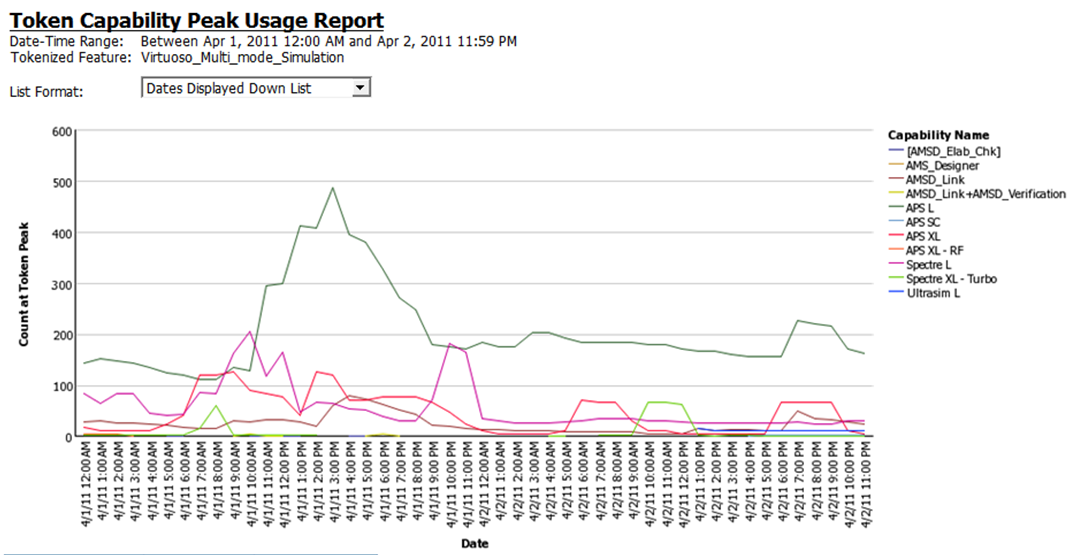
Part of a Token-Capability Peak Usage report.
See Also
Reporting on Token-Based Usage