Create Report Configuration: Summary Options
Using the Summary Options page, you select report breakdown categories and define the time periods for which you want usage data.
To specify summary options:
| 1. | In the Breakdown Categories section, select the categories you want to use in this report. Report breakdown categories enable you to specify categories for which you want the report to display data. You can specify multiple breakdown categories. |
|
Description |
|
|
Expiration Date |
Enables you to know when a license is expiring and who is using that license so you can decide whether to renew the license depending on the level of license usage. |
|
Hostid on Feature Line |
Enables you to compare the usage among multiple report logs from multiple license servers. This helps with load balancing on the servers. |
|
Group |
Enables you to group users to represent a department or project. Reports can be broken down by group to provide an allocation of cost by project or department. Reserving licenses can be done by group also. |
|
User |
Enables you to see usage per user. |
|
User Display Name |
Enables you to see usage per display name. |
|
FlexNet Licensing Version |
Provides the version of FlexNet Publisher licensing being used. |
|
User Host Name |
Enables you to determine if a user is using multiple licenses on different machines. The host name might be a user’s department or country. |
|
User IP Address |
Provides the IP address of the machine that the application is running on. This is usually assigned dynamically. |
|
User Platform |
Provides the type of platform the application is running on. Allows you to know if old versions are being used, or if the wrong platform is being used. |
|
User Product Version |
Shows the version of the product that is used |
|
User Project |
Provides a project’s number. A project number is set in an environment variable and can be reported for several reasons, including the cost of software for a project. |
|
Checkout Data |
Value of CHECKOUT_DATA passed by the application to the license server when the license was checked out. |
|
Vendor String |
Provides the version numbers of a string of applications in the package. |
|
Version |
Provides the application’s version number, which enables you to identify the version that the user is using and track who is using which version of the software. |
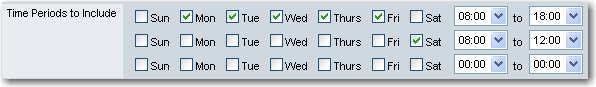
| 2. | In the Time Periods to Include section, specify the days and time ranges for which you want usage data. The report will contain only the data from the selected time periods. |
For example, to include only usage data for Monday through Friday, from 8:00 a.m. to 6:00 p.m., and for Saturday from 8:00 a.m. to noon, select the following:
| 3. | From the Summary Period list, choose the unit of time for which you want the report to calculate usage activity. |
| • | For High Water Mark and Usage Over Time reports, the summary period represents the granularity of the report. Longer summary periods are useful when generating Usage Over Time and High Water reports over long reporting periods to control the size of the report. |
| • | For Peak Usage and Denial, Summary Barchart, and Usage Summary reports, the summary period represents the time interval by which to subdivide the report—an individual bar or line of data is displayed per summary period. For example, using a summary period of Month shows usage statistics on a monthly basis for the entire reporting period. If the summary period is too small, the report display may be unreadable. |
Changing the default Summary Period setting affects the efficiency of the FlexNet Manager for Engineering Applications report generator. Setting a summary period for a Usage Over Time or High Water Mark report reduces the amount of data and can result in less overall memory usage and faster report execution and display. Conversely, setting a summary period for a Summary Barchart or Usage Summary report—or changing the summary period for a Peak Usage and Denial report to a smaller unit—increases the amount of calculations and memory required.
Choose a summary period that is appropriate for the type of report you are generating and the duration of your report data.
| 4. | Select the Show Zero Usage check box to display all features in a report, regardless of whether they have been used during the report period. |
Note:This option is available for Usage Over Time, High Water Mark, Summary Barchart, and Usage Summary reports.
See Also