Summary Barchart Report
A Summary Barchart report provides a useful format for comparing license utilization across users, features, and so on, and is based on calculations made in a Usage Summary report. By default, a Summary Barchart shows usage for each feature that was used. License usage is displayed as bars whose heights represent one of the following metrics:
| • | Num Used (number of licenses checked out) |
| • | % Used (percentage of available license hours used) |
| • | Hours Used (number of available license hours used) |
| • | Max Used (maximum number of licenses checked out at a time) |
The bars are arranged in alphabetical order. The following figure shows an example of the percentage of available license hours used, summarized by feature. The following report compares the number of checkouts for each feature.
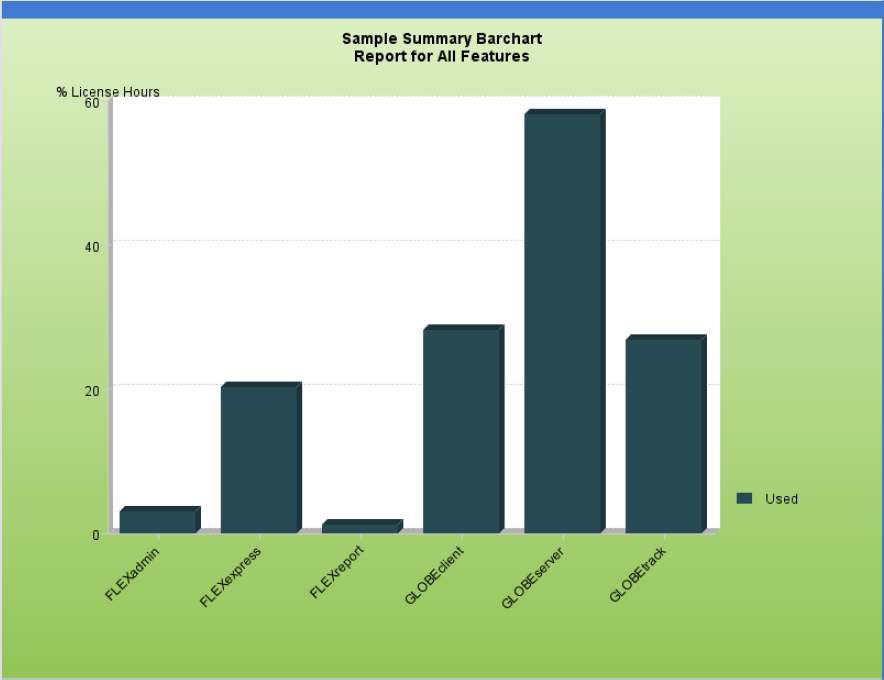
Summary Barchart report
Here is the same report of licenses used, summarized by Feature, then User. It compares the number of checkout requests satisfied for each user of a feature.
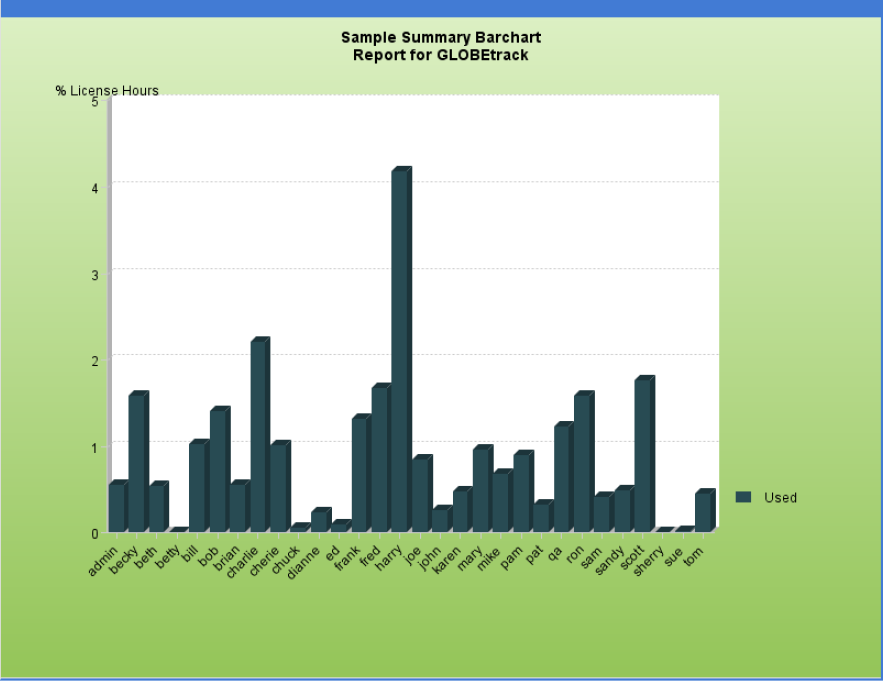
Summary Barchart report, summarized by Feature, then by User
Here is an example of the same report with license usage summarized by feature over each day in the report log. This report compares the daily usage levels for each feature over the reporting period.
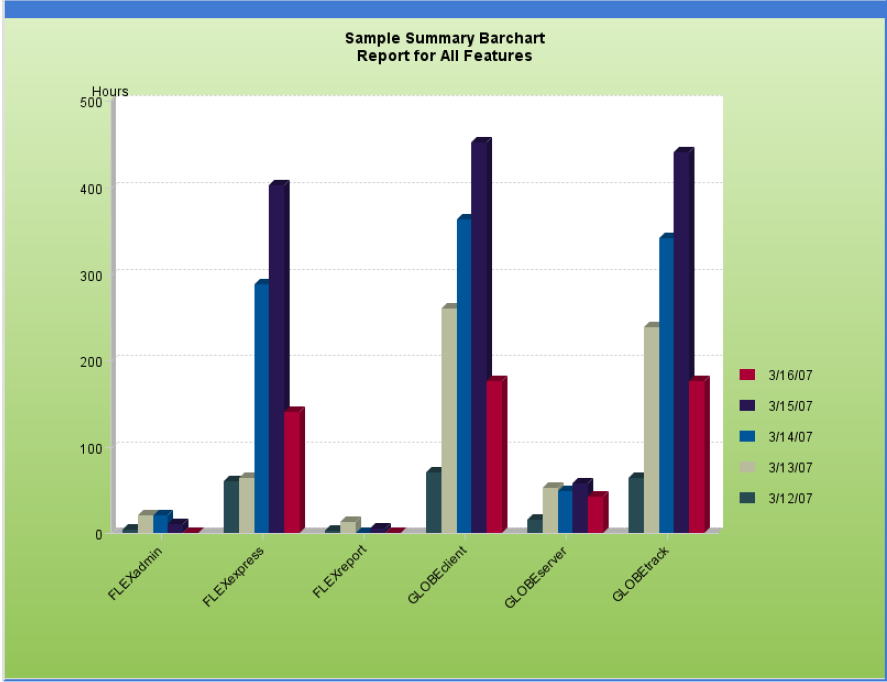
Summary Barchart report, summarized by feature over each day in the reporting period