Create Report Configuration: Graph Options
The Graph Options page enables you to customize the look of your finished report. You can use a predefined (or standard) style or you can create a custom look, in which you choose a color scheme, define text properties, and specify a line style.
Using Predefined Graph Options
FlexNet Manager for Engineering Applications provides several predefined graphic themes, which you can apply to your reports.
To specify predefined graph options:
| 1. | In the Title box, type the title that you want displayed on the finished report. |
| 2. | For the Style option, select Standard. |
| 3. | In the Theme section, click a theme image to select a graphic theme for your report. |
| 4. | Click Finish. |
Using Custom Graph Options
If you want full control over the way in which your report data is displayed, use the Custom style option to define report graph options.
To specify custom graph options:
| 1. | In the Title box, type the title that you want displayed on the finished report. |
| 2. | For the Style option, select Custom. |
| 3. | Specify the colors that you want to apply to different graphical elements. You can either type a hexadecimal color code or use the color selector to pick a color. |
Note:Not all elements are used in every report configuration.
|
Element |
Description |
|
Background |
Background color for the entire report. |
|
Text |
Color used for all text used in the report. Tip:To maximize readability, choose a text color that contrasts with the background color (and the auxiliary color, if you choose to use a gradient effect). |
|
Plot Area |
Color used for the report plot area, which is the area bounded by the axes. This is where your report data graph is displayed. |
|
Usage |
Color used to display the license usage line. |
|
Available |
Color used to display the available license line. |
|
Overdraft |
Color used to display the overdraft license line. |
| 4. | Specify whether you want to use a color gradient in the report background. |
|
Option |
Description |
|||||||||||||||
|
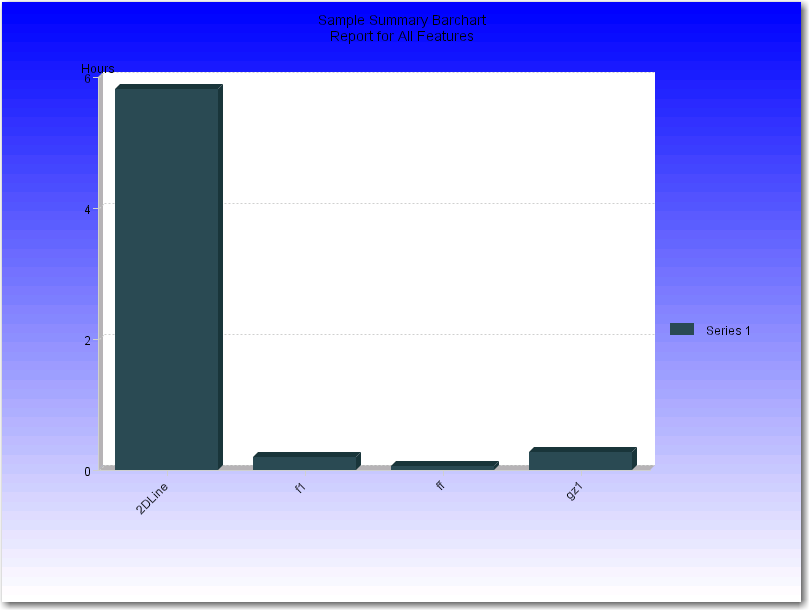
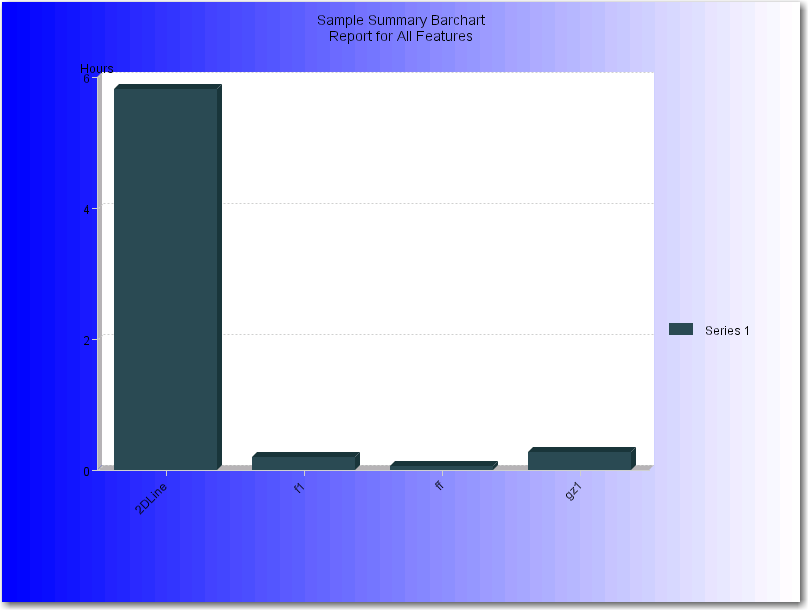
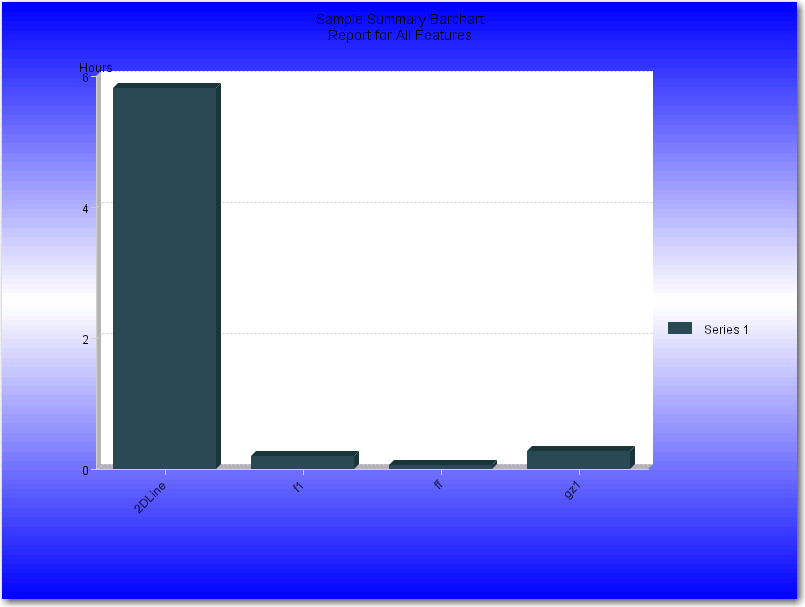
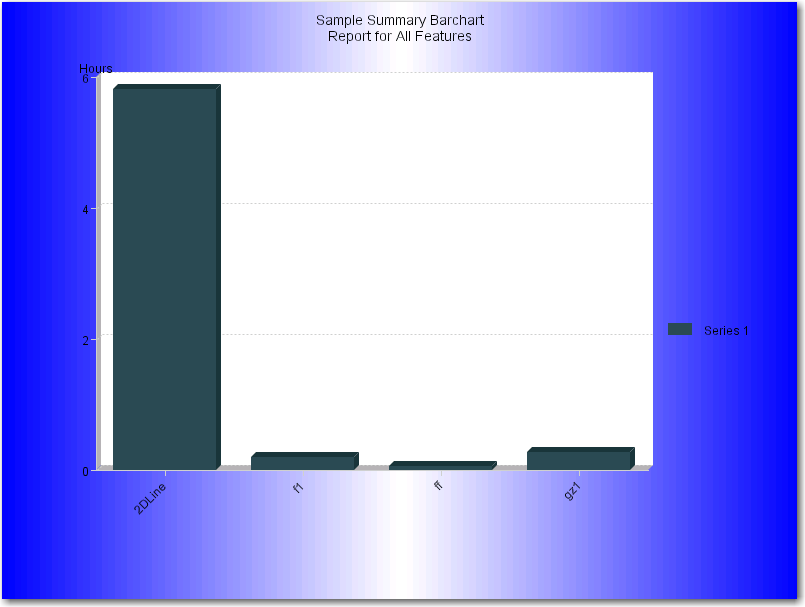
Style |
Choose whether you want to apply a gradient effect to the report background. With a gradient, the color that you specified for the background color fades into the color you specify in the Auxiliary Color field. The following sample graphics use blue as the background color and white as the auxiliary color.
|
|||||||||||||||
|
Auxiliary Color |
The color that, when used with the selected background color, creates the gradient effect. |
| 5. | For Summary Barchart reports, select a Bar Color Palette option. |
| 6. | If you want to use 3D effects in your report, select the Use 3D effect check box and choose the pixel depth from the list. |
| 7. | Specify the report text properties. |
|
Option |
Description |
|
Font |
The font to use for all text displayed in the report. Available fonts are dependent on your machine’s platform. Using International Characters in Reports The use of international characters in reports may require special fonts. For example, if a feature, host, or user name contains Japanese characters, then a report with that feature or breakdown will provide a report image with those Japanese characters in the title. To correctly display international characters in a report, you must specify a font that has the required characters. |
|
Style |
Whether you want to use Normal, Bold, Italic, or Bold Italic font for the text displayed in your report. |
|
Size |
Font size, in points. |
| 8. | Choose a line style. |
|
Option |
Description |
|
Width |
Width, in pixels, of the lines displayed in the graph. |
|
Style |
Line style. |
| 9. | Click Finish. |
See Also