Peak Usage and Denial Report
The Peak Usage and Denial report creates a bar chart report that shows the following information:
| • | Number of peak usage licenses within the specified summary period. You can specify a summary period with a granularity of seconds, minutes, hours, days, weeks, or months. |
| • | Number of denials within the summary period, if there were any. |
| • | An optional availability line, which shows the number of available licenses at a particular time. |
| • | An optional overdraft line, which shows the number of overdraft licenses at a particular time. |
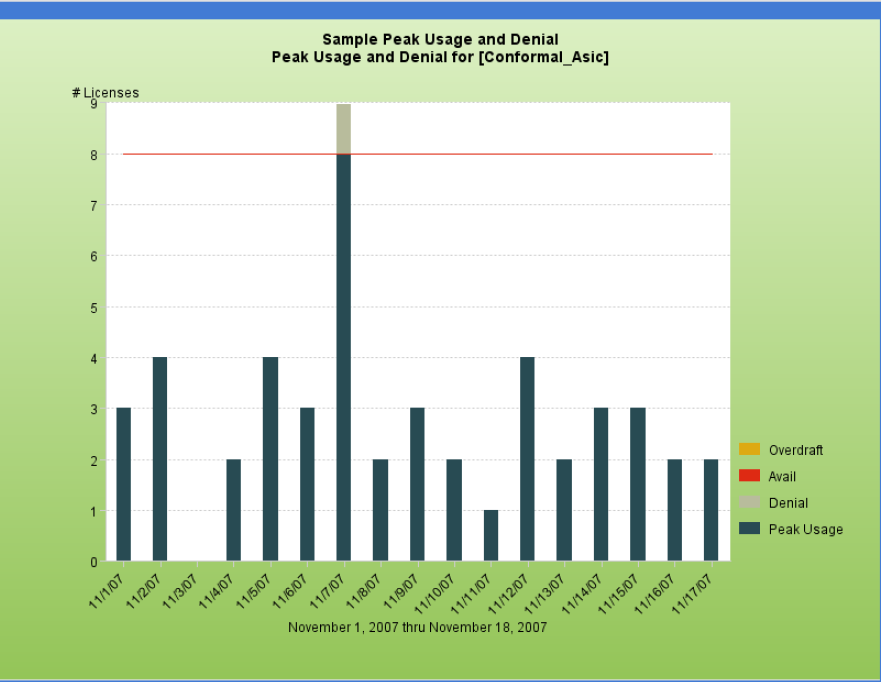
Peak Usage and Denial report
Note:There are rare cases when the vendor daemon reports unsupported events in the report log as ultimate denials instead of unsupported events. These events appear in the report log as ultimate denials, but unlike standard ultimate denial events, these events do not have any license feature associated with them. FlexNet Manager for Engineering Applications reports these events as unsupported events, rather than denials.