Product Peak Usage Summary Report
When you run a Product Usage Statistics report, the first view is the Product Peak Usage Summary report. This report provides a view of your organization’s product usage for a given time period, and it includes the information described in the following table.
You can view data for the past 3 months, 6 months, or 12 months by clicking the corresponding tab at the top of the report. The reporting period covers n complete months of data prior to the current date. The reporting period begins on the first day of the first month and ends on the last day of the last month in the period. For example, if you run the report on 06/12/2017, the following date ranges apply:
| • | 3 Months: 03/01/2017–05/31/2017 |
| • | 6 Months: 12/01/2016–05/31/2017 |
| • | 12 Months: 06/01/2016–05/31/2017 |
Note:This report is not fully compatible for use with hybrid organizational structures. If you have enabled organizational structures for hybrid aggregation, this report will run, but will show usage data by organization structure without breakdown by license servers.
You can view more detailed usage data by clicking a link within the report.
|
Metric |
Description |
|
Product name |
Display name of the product. |
|
Available |
The maximum number of product licenses available during the reporting period. If a delta icon Important:Product-availability information is available only if you have input contract data using investment-planning functionality (available under the Planner tab in FlexNet Manager for Engineering Applications). For information on using this functionality, see the Investment Planning section in the product’s online help. |
|
Peak |
The highest daily peak usage that occurred during the reporting period, for a specific product. Click a number link to open the Product Peak Usage Details Report for a product. |
|
Count of peak |
The number of times during the reporting period that the highest daily peak usage occurred. For example, if the highest daily peak usage during the period was 20 and this usage number occurred twice during the reporting period, the Count of peak value would be 2. Click a number link to open the Count of Peak Occurrences Report (Product). |
|
Average peak |
The average daily peak during the period. This is the sum of the daily peaks divided by the number of days in the reporting period. |
|
Denials |
The number of ultimate denials for this product during the reporting period. Click a number link to open the License Request Daily Denials Report (Product). |
|
Unique users |
Number of unique users who used this product during the reporting period. |
|
Hours of usage |
Total number of hours this product was in use during the reporting period. |
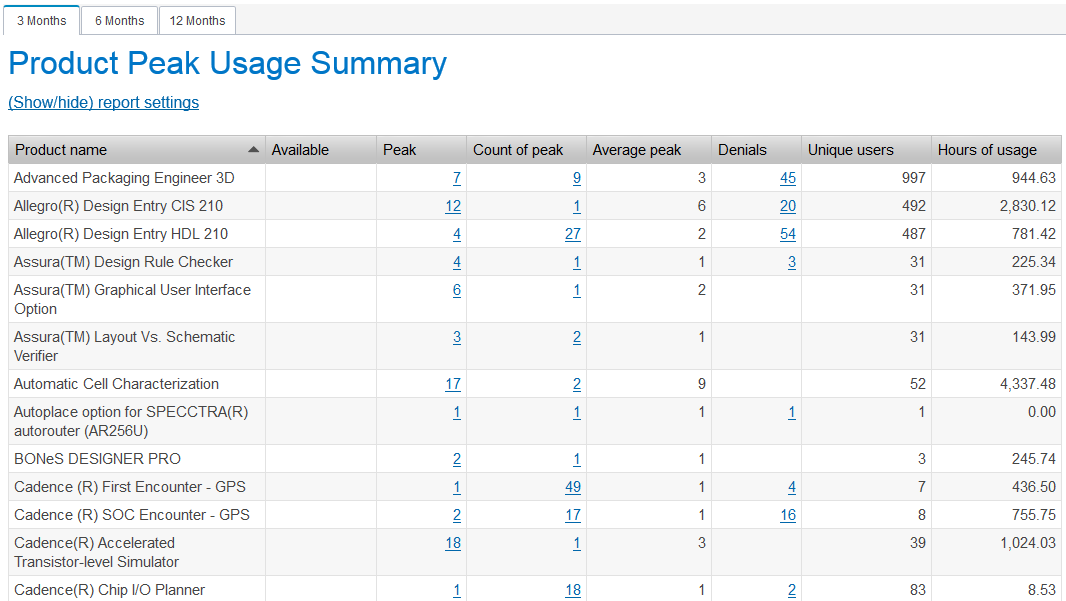
Product Peak Usage Summary report