This report displays a graph showing the peak usage of specified features by the entire organization, and by the different nodes within the organization. The report also shows maximum feature availability. A separate graph is produced for each of the specified features.
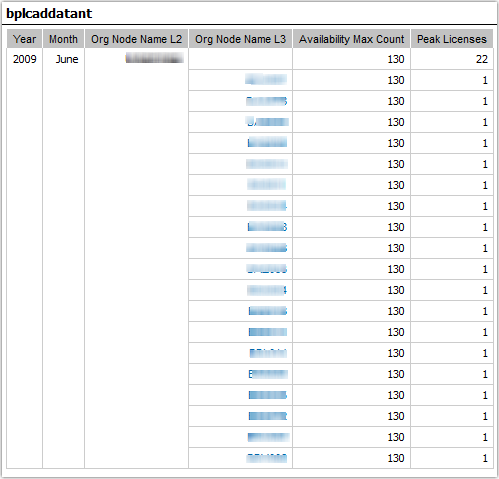
In addition to the graphs, this report provides a table for each feature, showing maximum availability and peak license usage by year/month, and by organizational-structure node.
Note • If you have enabled an organizational structure for hybrid aggregation, you can run this report for a hybrid organizational structure (by selecting a hybrid organizational structure in the Organization prompt). This enables you to see usage for a specific license server. See Hybrid Organizational Structures for information.
See Running Feature Usage (Historical Feature) Reports for the steps to run this report.
Peak Usage by Organization Over Time report
See Also
Reporting on Feature Usage (Historical Feature Reports)
Running Feature Usage (Historical Feature) Reports
FlexNet Manager for Engineering Applications 2019 R2 Help LibraryOctober 2019 |
Copyright Information | Flexera |