Advisories
The Advisories page displays widgets that contain information regarding:
|
•
|
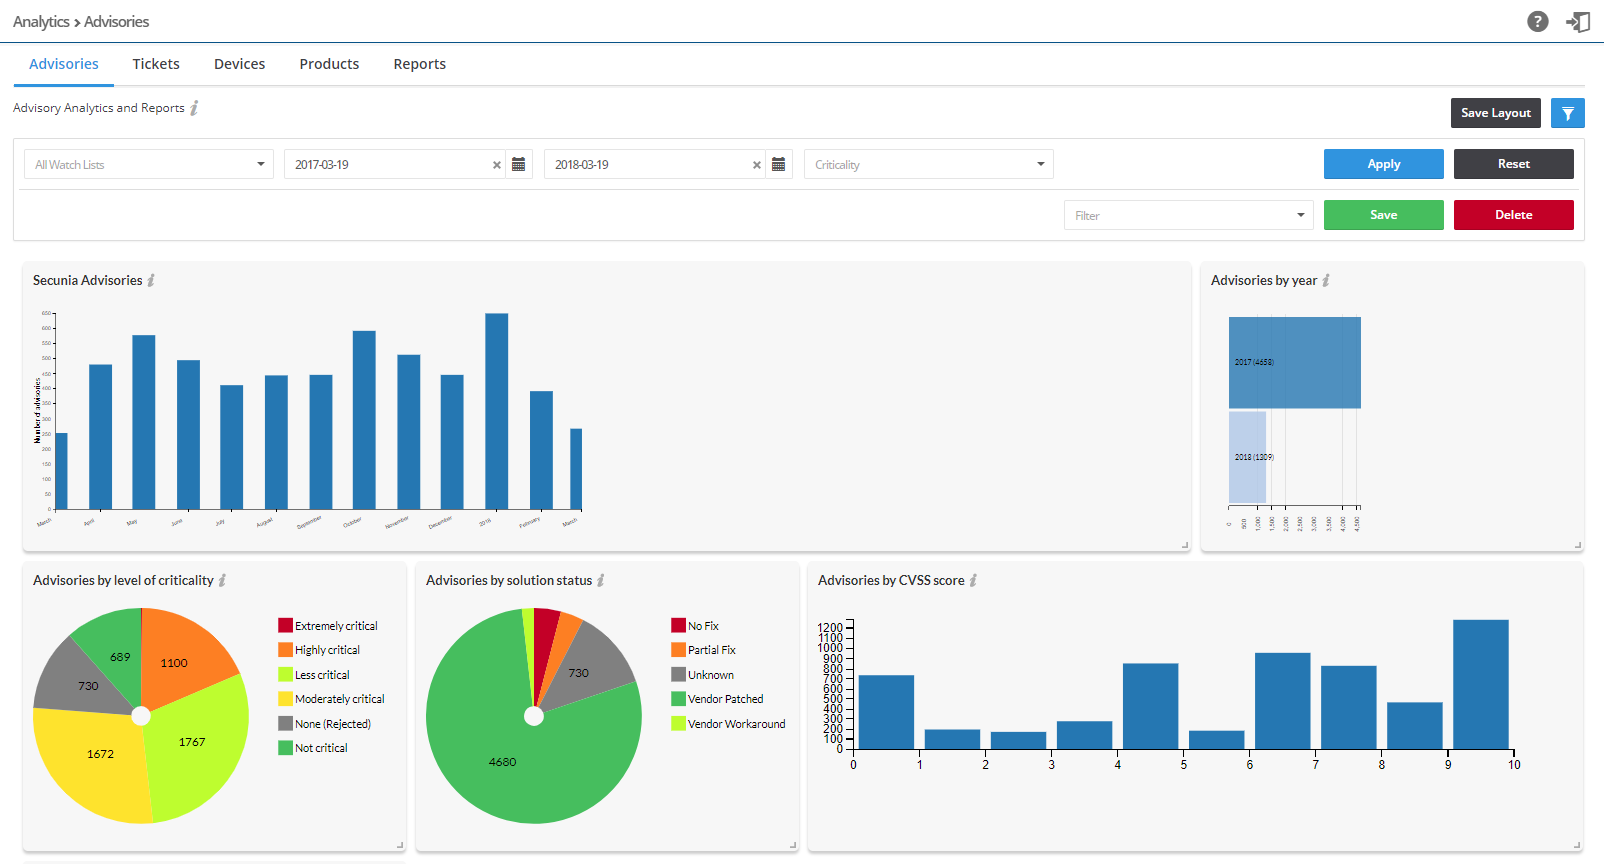
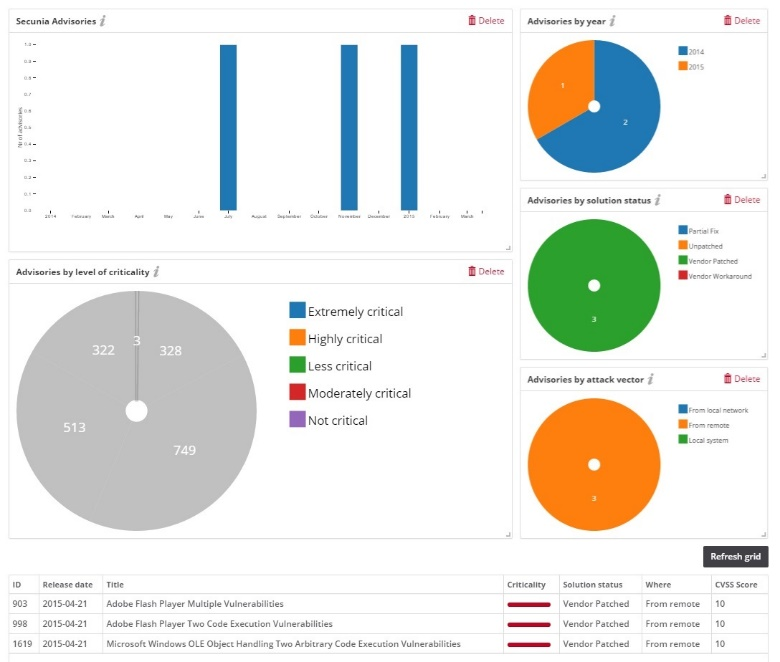
Secunia Advisories—Displays a month-by-month bar chart of the number of advisories based on your configured Watch Lists. |
|
•
|
Advisories by year—Displays a bar chart of the number of advisories based on your configured Watch Lists. |
|
•
|
Advisories by level of criticality—Displays a color coded pie chart of the criticality levels (Extremely critical, Highly critical, Less critical, Moderately critical, None (Rejected) and Not critical) of advisories based on your configured Watch Lists. |
|
•
|
Advisories by solution status—Displays a color coded pie chart of the solution status (None (Rejected), Partial Fix, Unpatched, Vendor Patched and Vendor Workaround) levels of advisories based on your configured Watch Lists. |
|
•
|
Advisories by attack vector—Displays a color coded pie chart of the attack vector (From local network, From remote, Local system, and None (Rejected)) of advisories based on your configured Watch Lists. |
|
•
|
Advisories by CVSS score—Displays a bar chart of the CVSS score intervals for the Advisories. The intervals follow standard mathematical notation, for example, (3 , 4] means strictly greater than 3 and less than or equal to 4. The interval starts from the date when the advisory was added to the ticketing system. |
The Analytics widgets are dynamic, and you can segment information by clicking the individual chart legends or segments in any widget - with the exception of Secunia Advisories and Advisories by year - to alter the data displayed in all widgets and the Advisory details grid accordingly.
Note:Click the  icon to see more information about the widget.
To view analytics for advisories:
|
1.
|
Open the Analytics > Advisories page. |
|
2.
|
Click  to filter the results by Watch List, From and To dates, and Criticality (select from drop-down menu). to filter the results by Watch List, From and To dates, and Criticality (select from drop-down menu). |
|
3.
|
Click the Apply or Reset buttons to apply or reset the filters. |
|
4.
|
Click the Save or Delete buttons to save or delete filters. You can save only one row on both the desktop and mobile UI. |
|
5.
|
Click Save Layout to save the page layout. Adjusting the size of the widgets activates this function. |
|
6.
|
In the example above, clicking the Extremely critical legend in the Advisories by level of criticality widget, and then clicking Refresh grid, displays the relevant data. |
|
7.
|
Click the legends or segments again to return to the original, unfiltered, information displayed. |
|
8.
|
Click a Secunia Advisory ID (SAID) to view the complete Advisory details, including (where applicable) the Creation Date, Criticality (Severity Rating), Zero Day (yes or no), Impact (Consequence), Where (Attack Vector), Solution Status, Secunia CVSS (Common Vulnerability Scoring System), CVE References, Affected operating system and software, Affected watch lists, Related tickets, Advisory Description, Reason for rating, Original advisory references and Changelog. Click Download PDF to save a copy of the advisory. |