Dashboard without Threat Intelligence Module
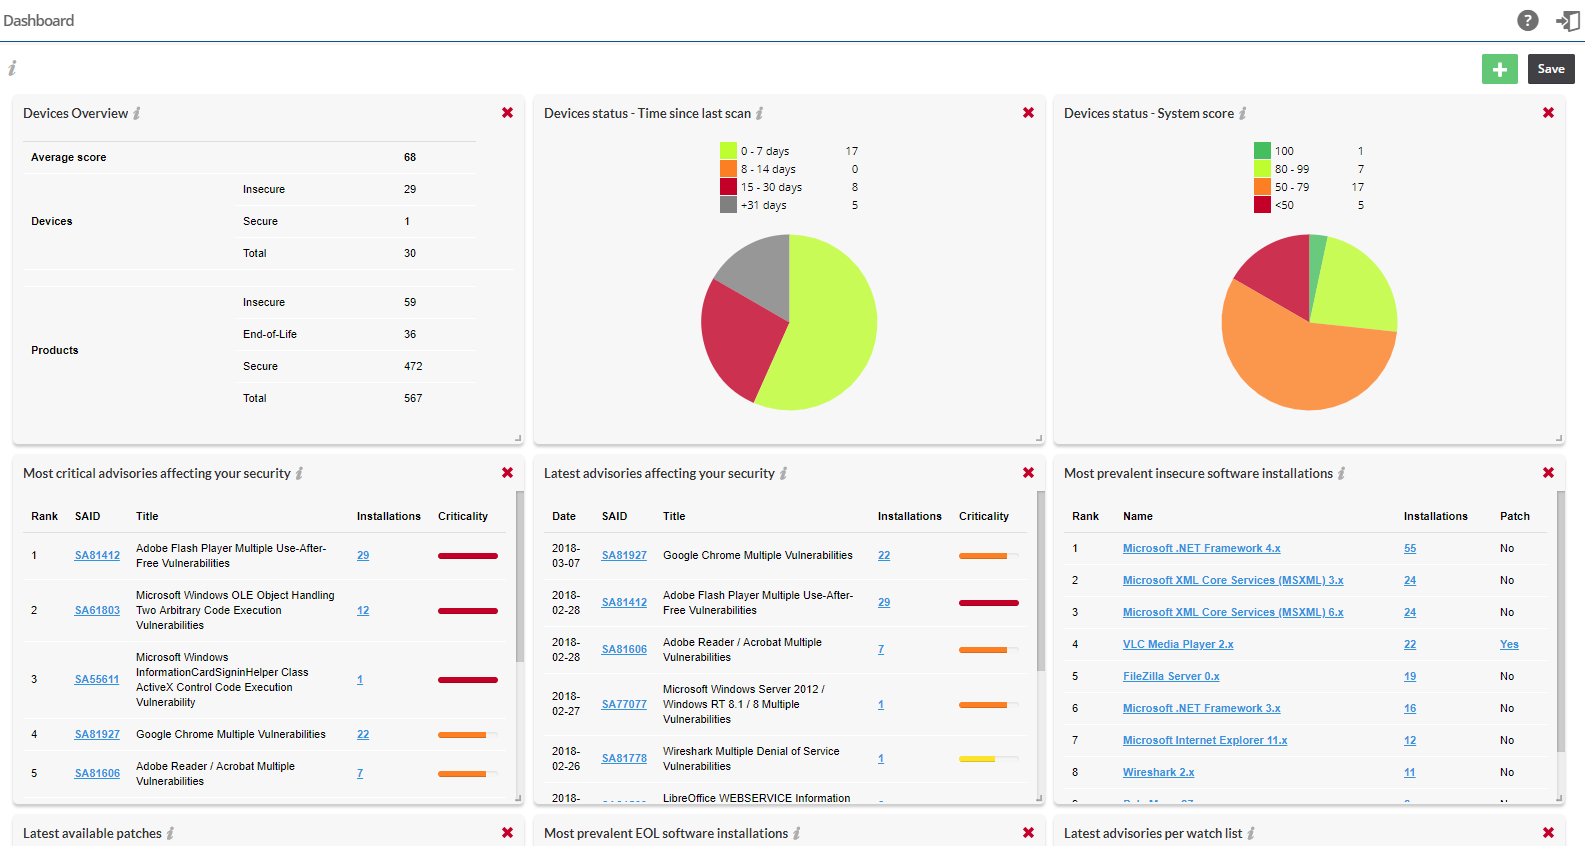
The below figure shows the Dashboard without the Threat Intelligence module.
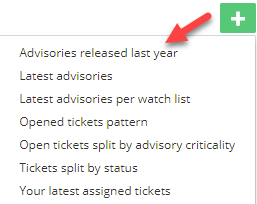
Click  to add widgets (when available) and Save to save the changes you made.
Note:Click the  icon to see more information about the widget.
The Dashboard widgets on the main page includes the following:
|
Item |
Description |
|
Devices Overview |
Displays an overview of the average security score (current verses last week) for the Devices, Products and Operating Systems within your environment. |
|
Devices status - Time since last scan |
Displays the number of devices that have been scanned within a given time frame. |
|
Devices status - System Score |
Displays how your devices rank based on the computed system score. |
|
Most critical advisories affecting your security |
Displays the most critical Advisories based on all software detected within your environment. |
|
Latest advisories affecting your security |
Displays a complete list of the latest Advisories released by Secunia. Click a Secunia Advisory ID (SAID) to view the complete advisory details, including (where applicable) the Creation Date, Criticality (Severity Rating), Impact (Consequence), Where (Attack Vector), Solution Status, Secunia CVSS (Common Vulnerability Scoring System), CVE References, Affected software and Advisory Description, Solution, References and Changelog. |
|
Latest advisories affecting your security |
Displays the most recent Advisories affecting software from your Devices. |
|
Latest advisories per watch list |
Displays the most recent Advisories released by Secunia based on your configured Watch Lists. Click a Secunia Advisory ID (SAID) to view the complete advisory details, including (where applicable) the Creation Date, Criticality, Impact, Where, Solution Status, Secunia CVSS Scores, CVE references, Affected software and Advisory Description, Solution, References and Changelog. |
|
Advisories released last year |
Displays a month-by-month graph of the total number of advisories released by Secunia over the previous 12 months. |
|
Your latest assigned tickets |
Displays the latest tickets that have been assigned to you. Click a Secunia Advisory ID (SAID) to view the complete advisory details, including (where applicable) the Creation Date, Criticality, Impact, Where, Solution Status, Secunia CVSS Scores, CVE references, Affected software and Advisory Description, Solution, References and Changelog. |
|
Open tickets split by advisory criticality |
Displays a color coded pie chart of the criticality of all open tickets assigned to you. Hover over the criticality legend (Low, Medium, High and Urgent) to display a tooltip with the total percentage of tickets applicable to the ticket criticality. |
|
Tickets split by status |
Displays a color coded pie chart of the statistics of all tickets assigned to you. Hover over the ticket type legend (Open, Waiting, Handled and Irrelevant) to display a tooltip with the total percentage of tickets applicable to the ticket type. |
|
Open tickets pattern |
Displays a trend line of the number of tickets that have been created based on your configured Watch Lists. The trend line applies to the status of all ticket types (Open, Waiting, Handled and Irrelevant). |
|
Most prevalent EOL software installations |
Displays the list of End-of-Life (EOL) software installations that no longer provide security fixes, which can lead to insufficient firewall and anti-virus protection. Please note that Flexera’s definition of EOL software may differ from a software vendor’s. |
|
Most prevalent insecure software installations |
Displays the most insecure software based on the number of Devices within your environment. |
|
Latest available patches |
Displays the latest available patches based on your scan results. |