Stacked Area Charts
Note:
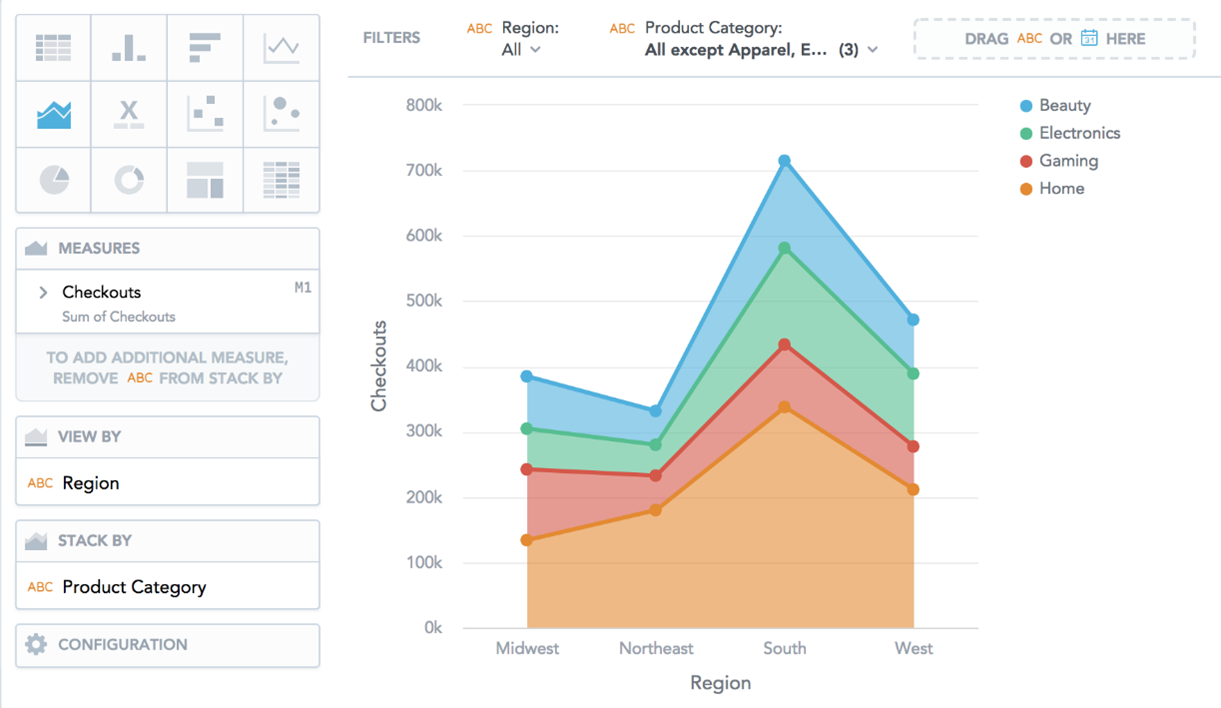
Stacked area chart shows data as an area under a line that connects data points. They are similar to line charts and express changes across time.
Stacked area charts have the following sections: Measures, View by, Stack by, and Configuration.
In stacked area charts, you can also:
| • | Display the values as a percentage. You must add Dates or Attributes to the View by section. |
| • | Stack the chart by attribute or date. To add an attribute or date to the Stack by section, you must have only a single item in the Measures section. If you have multiple measures in the Measures section, you can stack the measures. For details, see Stack Measures. Slice your data by up to two dates or attributes. |
| • | Add the dates or attributes to the View by section. |
For information about common characteristics and settings of all insights, see Insight Types.
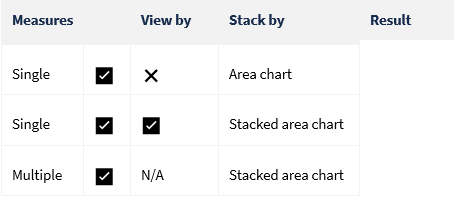
You can add a single measure or multiple measures to create different types of area charts.