The Components of Data Explorer
Note:
IT Visibility Visibility is being upgraded with the introduction of Technology Intelligence Platform beginning in September 2024. Flexera will contact you directly regarding the timeframe of your upgrade. With Technology Intelligence Platform, out-of-the-box IT Visibility dashboards are being replaced with new, enhanced IT Visibility Technology Intelligence Platform reports. For more information, see IT Visibility With Technology Intelligence Platform Reports.
In Data Explorer, you can customize various types of visualizations of your data.
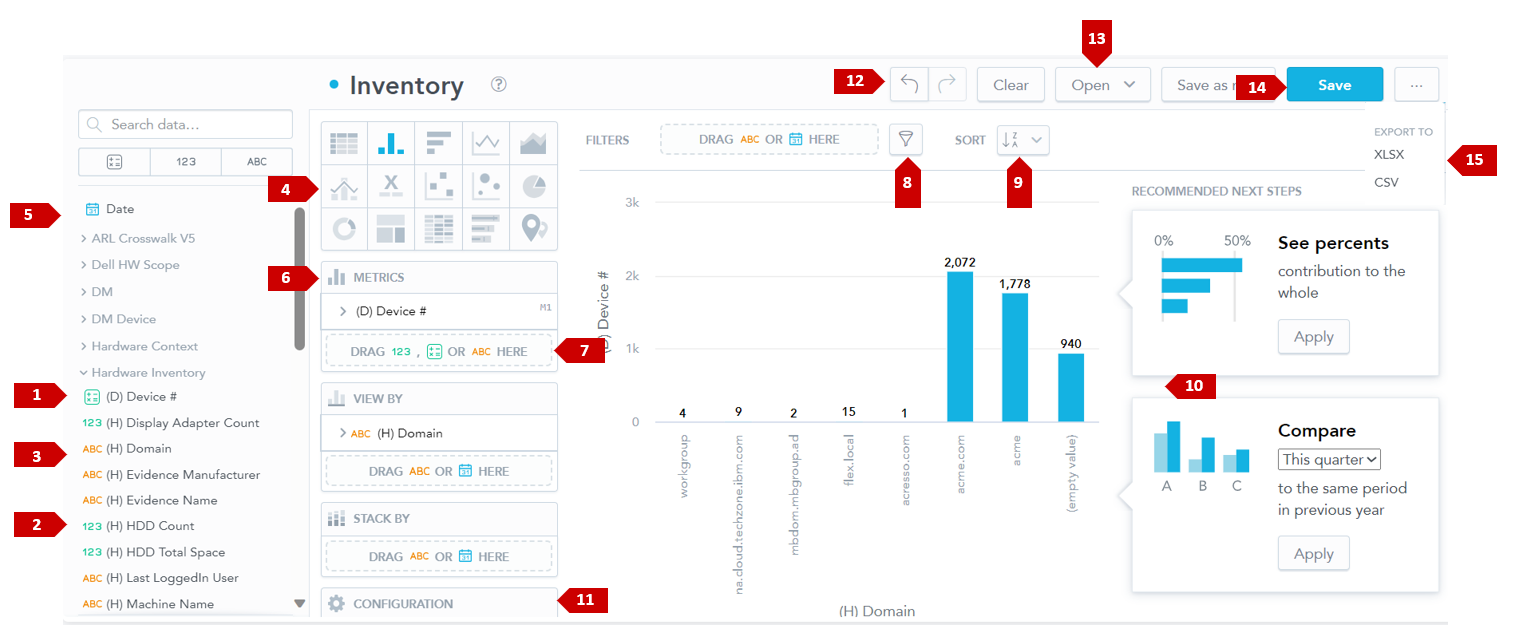
The numerical callouts in the screenshot correspond to the following description to help you understand what you can do in Data Explorer. You can:
|
1.
|
Analyze metrics  that represent quantitative data. that represent quantitative data. |
|
2.
|
Analyze facts  that represent quantitative data. that represent quantitative data. |
|
3.
|
Analyze attributes  that represent qualitative data. that represent qualitative data. |
|
4.
|
Switch among different types of insights. For details, see Insight Types. |
|
5.
|
Drag data from your Data Catalog to any active drop zone on the canvas to start creating your insight or visualization. |
|
6.
|
Drag data from these zones back to Data Catalog to remove them from your insight. |
|
8.
|
Drag the Date or any attribute to the filter bar to filter your data, or click the filter icon to select attributes from your insight. For details, see Filtering Measures by Date. |
|
9.
|
Sort the insight within the chart to improve the readability of stacked charts (such as bar charts, column charts, or stacked area charts). |
|
10.
|
Modify your insight based on common usage patterns with the help of recommendations. |
|
12.
|
Navigate between steps or clear your insight. |
|
13.
|
Open a saved insight. |
|
15.
|
Export your insights into files for further analysis. For details about exports, see Exporting Insights. |