Using Filters in Data Explorer
Note:
To refine the data your insight shows, you can add various filters to your insights.
| • | Filter the whole insight by attributes and date. |
| • | Filter individual measures in the insight by attributes. For more information, see Creating Insights to Visualize Your Data. |
| • | Filter individual measures in the insight by date. For more information, see Filtering Measures by Date. |
| • | Filter the whole insight by measure values. For more information, see Filtering Insights by Measure Values. |
| • | Filter the whole insight by a number of top/bottom values. For more information, see Ranking Filter. |
KPI Dashboards do not override attribute filters from insights. For details about interactions of date filters, see Filtering Measures by Date and Date Filters in Dashboards.
Adding Filters for the Entire Insight
To filter your insight, you must add attributes or date to the filter bar. You have two options:
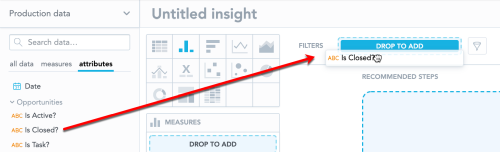
| • | Drag attributes or date from the Data Catalog and drop to the FILTERS > DROP TO ADD area. Data Explorer enables the filter automatically. |
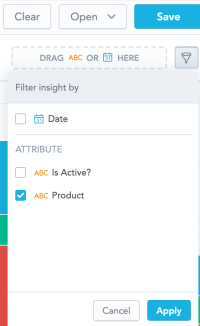
| • | Add attributes or Date to the insight (other than the Measure(s) section) and enable it in the FILTERS dropdown menu. Then, refine your data. |
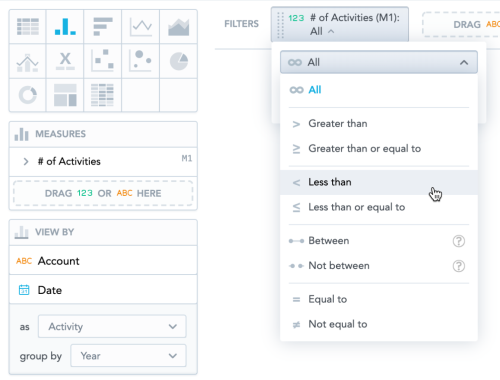
| • | Select any measure from the insight in the FILTERS dropdown menu. Then refine your data. |
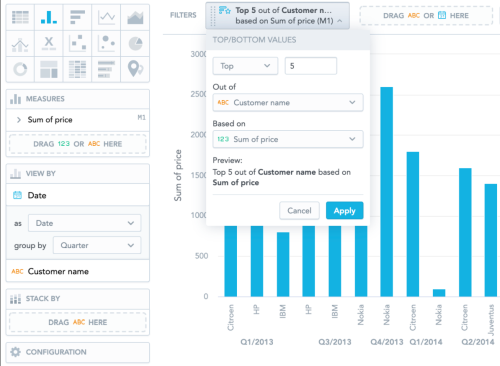
| • | Select Top/bottom values in the FILTERS dropdown menu. Then refine your data. |
Refining Filters
To refine a filter:
| 1. | Click the filter name in the filter bar. |
| 2. | Do any of the following: |
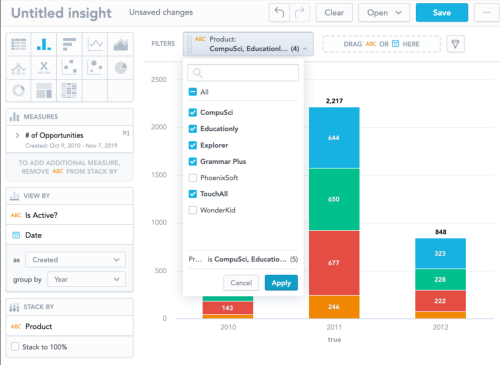
| • | For attributes, select options to display or hide. |
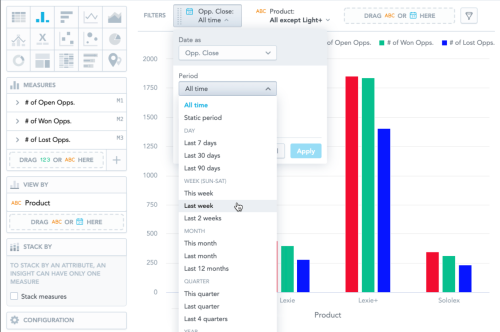
| • | For dates, select the period to be filtered. |
| • | For measures, specify the filter. For details, see Filtering Insights by Measure Values. |
| • | For top/bottom values, specify the filter. For details, see Ranking Filter. |
| 3. | Click Apply. |
Note:If you add the attribute to filter the insight first and then you add unrelated measures or attributes to the Measure(s) section, the attribute stays in the insight but does not filter the data. Data Explorer displays an informative message. If your attribute has multiple display labels, you can select the label in the filter definition.
Note:If you add the attribute to filter the insight first and then you add unrelated measures or attributes to the Measure(s) section, the attribute stays in the insight but does not filter the data. Data Explorer displays an informative message. If your attribute has multiple display labels, you can select the label in the filter definition.
Using Insight Date Filters
If you filter your insight by date, in the filter bar you can:
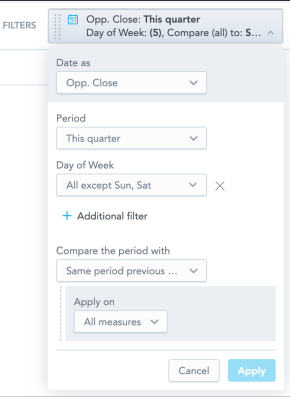
| • | Select the date dimension (the Date as option). If you change the date dimension, the Additional filters are reset. |
| • | Select the Period from which to filter the data. |
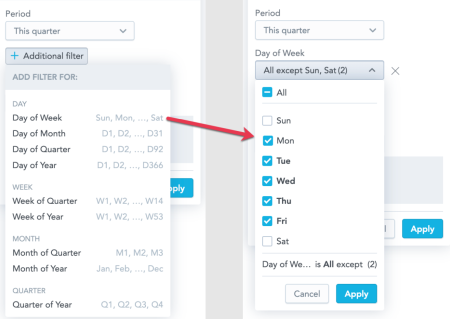
| • | Add Additional filters to filter by additional date granularities and attributes, such as day of week or month of year. |
| • | Compare data to another period (the Compare the period with option). For details, see Time Over Time Comparison. |
The following image shows a date filter that filters to workdays (Monday to Friday) in the current quarter and compares the data to the same period of the previous year:
Disabling a Filter for the Entire Insight
To disable a filter, drag the filter from the filter bar and drop it to the Data Catalog, or clear it in the filter bar dropdown menu.