Time Over Time Comparison
Note:
In Data Explorer, you can use the date filter for time over time comparison to analyze your data without using complex MAQL syntax.
You can compare data in Pivot Tables, Column Charts, Bar Charts, Line Charts, and Headlines.
You can use the compare feature in Data Explorer for the most common scenarios.
Refer to the following subsections on this page for additional information:
| • | Comparison Types |
| • | How Applying a Comparison Works |
You can compare your data with:
| • | Same period of the previous year—For example, you can display data for March 2018 and compare it to March 2017. |
| • | Previous period—For example, if you filter data for March 21-30 and apply the Previous period comparison, Data Explorer displays also your data for March 11-20. |
If you set the date filter to All time, you cannot enable the comparison.
Applying a Comparison
To apply a comparison:
| 1. | In Data Explorer, add Date to the Filters bar. |
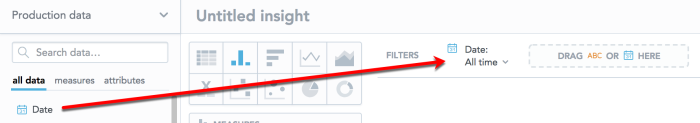
| 2. | Click the Date filter. |
| 3. | In the Compare the period with dropdown list, select Same period previous year or Previous period. |
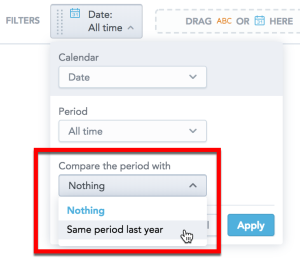
If you select All time in the Period dropdown, you cannot enable the comparison.
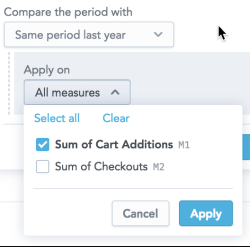
| 4. | In the Apply on dropdown, select measures that you want to compare and click Apply. |
Note:If you select All measures, the settings automatically apply to any new items that you add to the Measures section.
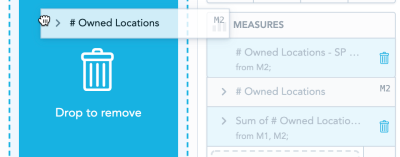
Note:You can change the comparison only in Data Explorer. On KPI Dashboards, you can change the period that the insight displays. If you remove the original measure, the derived measure (previous period or same period previous year) and measures derived from it are also removed. When you drag the original measure to the Data Catalog, Data Explorer highlights all the measures to be removed and then displays a message.
How Applying a Comparison Works
All items in the Measures section have dynamic sequence labels displayed in the top right corner of the item.
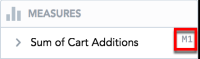
The sequence labels are floating. This means that the first item always has label M1, the second has M2, and so on. When you reorder the items, their label dynamically changes.
When you apply comparison, Data Explorer creates new items in the Measures section.
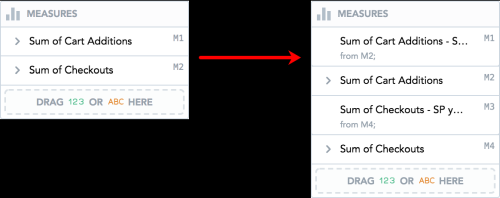
These items are derived from the original items:
| • | They are placed above the original item. Drag to reorder them. |
Note:If a headline insight has only one measure, the derived item is placed in the other Measures section. If the headline has two measures, the insight compares the measure from Measure (primary) and places the derived item to the Measure (secondary) section.
| • | They have information from which measure they are derived. |
| • | They have SP year ago or previous period added to their name. Click the name to rename them. For details, see Renaming Measures. |
| • | They have the same formatting and the same filters applied as the original measures. |
| • | When you delete the original item, the derived measure is deleted as well. |
| • | When you delete the derived measure, the original item stays. |
| • | You cannot add attribute filters and date filters to the derived items |