Flexera One app version 1.2 available now in the ServiceNow Store
Note:This app is available with IT Visibility.
Flexera helps you improve the value you derive from your ServiceNow investment from aggregation, normalization, and enrichment of hardware, software, SaaS, and cloud IT asset inventory data to IT service delivery. With Technopedia®, the most trusted source of IT product information in the world, Flexera enhances IT service management (ITSM), Configuration Management Systems, and Software Asset Management with a reliable foundation and accurate data.
The current version of the Flexera One ServiceNow app includes the following new capabilities.
| • | Flexera One Dashboards in ServiceNow—Flexera Hardware Dashboard and Flexera Software Dashboard |
| • | Improvements to Views and Menus Place the Information You Need Most Right at Your Fingertips |
Flexera One Dashboards in ServiceNow—Flexera Hardware Dashboard and Flexera Software Dashboard
A new Flexera One Dashboard view includes two dashboards: Flexera Hardware and Flexera Software. These new dashboards focus on your inventory data in ways that alert you to risks and highlight trends in your hardware and software assets. They also provide you with quick shortcuts to pre-filtered views of your hardware and software-related tables when you want to dig deeper into the data shown in the dashboards.
| • | The Flexera Hardware dashboard includes 9 different interactive charts to visualize your normalized hardware models, computers by class and by manufacturer, your top ten normalized hardware models and network gear models, your installed obsolete computers, and more. |
| • | The Flexera Software dashboard includes 6 different interactive charts that highlight software that is nearing its end of life, end of extended support/obsolescence, illustrates version sprawl and category sprawl, and alerts you to in-use software that is beyond its end-of-support date. |

The Flexera Software dashboard showing the Software Product and In-Use End of Support Software.
The dashboards’ interactive charts can be exported as JPEG or PNG images, and the content of the charts can be grouped, stacked, hidden, or revealed to customize what appears and how it is shown.
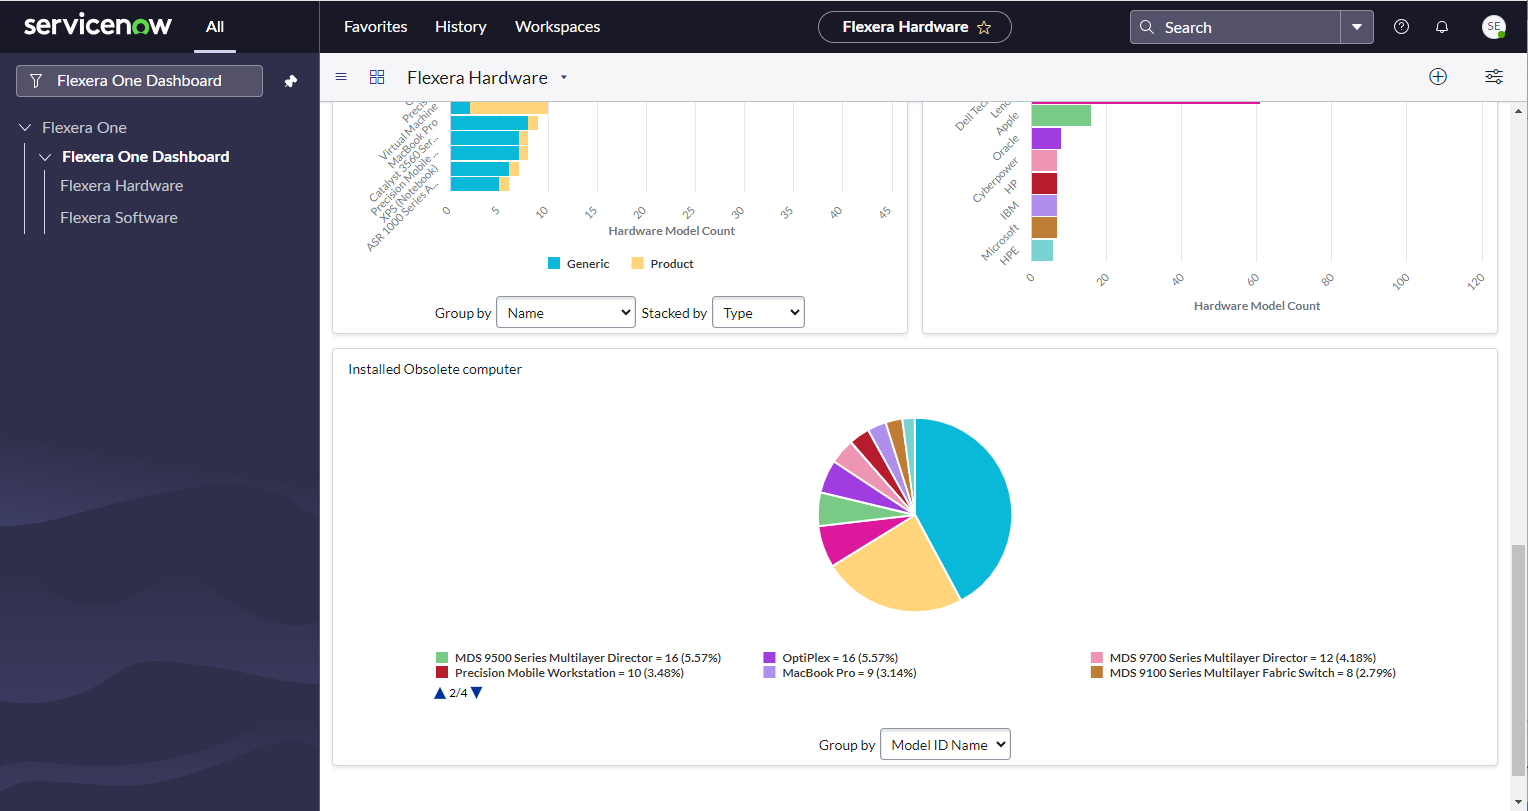
The Flexera Hardware dashboard showing Installed Obsolete Computer visualization.
You can click on the elements in each dashboard’s charts to open a pre-filtered view of the relevant table showing you the details for the element you clicked in Flexera One tables. For example, if you click an element in the Installed Obsolete Computer chart in the Flexera Hardware dashboard, the Flexera One app shows the Hardware Status for the obsolete computers associated with that element. In the screen capture, below, Apple Macbook Pro was the chart element clicked.
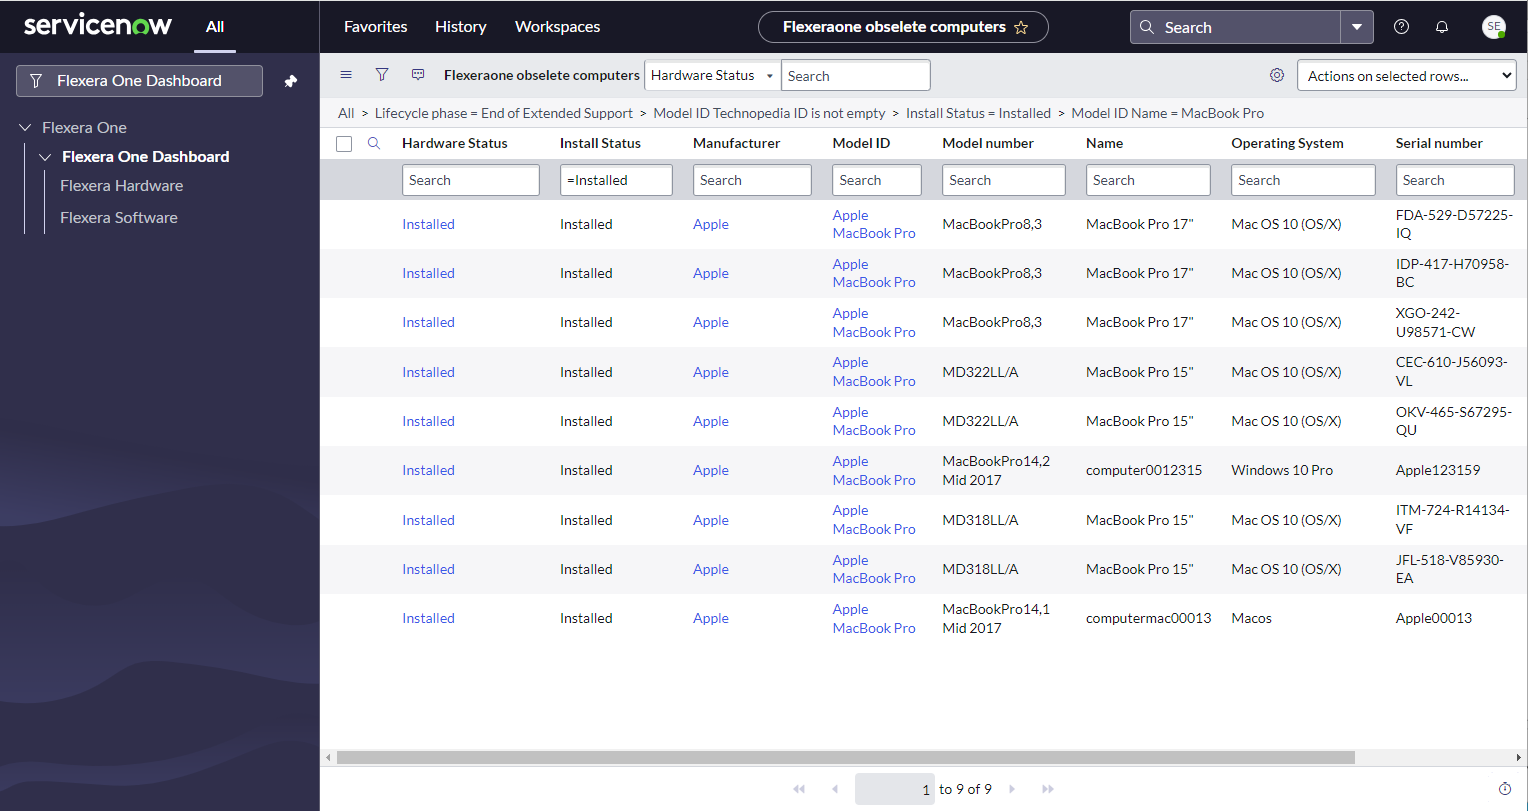
Hardware Status for obsolete computers with the Apple Macbook Pro as the Model ID.
Tip:In the Flexera One app, you can navigate to the new dashboards by entering Flexera One Dashboard in the Filter navigator and clicking Flexera Hardware or Flexera Software.
Improvements to Views and Menus Place the Information You Need Most Right at Your Fingertips
With this release, we have improved the default form views so that the information you need most appears in the first columns while the columns themselves are ordered into natural groupings. These first columns show the fields that are most relevant to the data mapped in ServiceNow on Flexera’s import tables.